This quick look will provide guidance for how you can demonstrate security program effectiveness using Reasonable Risk. Additionally, you will see how to provide the c-suite a roadmap for your program that reduces risk to an acceptable level by answering the questions, "are we where we need to be and if not, when will we get there?"
1. Demonstrating an Effective Program
Demonstrating an Effective Program.
To demonstrate an effective governance program, it is optimal to show risk reduction projections on a multi-year roadmap. Here are some considerations for the effectiveness of your program.
Why is providing a roadmap so difficult?
It is difficult to maintain risk models with changing data over time.
If you do a good job, you’ll be asked to always produce it going forward.
How do you define if the overall Risk Level is “OK” or not?
And if the Risk Level is “Not OK”, how do you define “how to get to OK?”
Let’s take a look at an actual example.
2. First Step
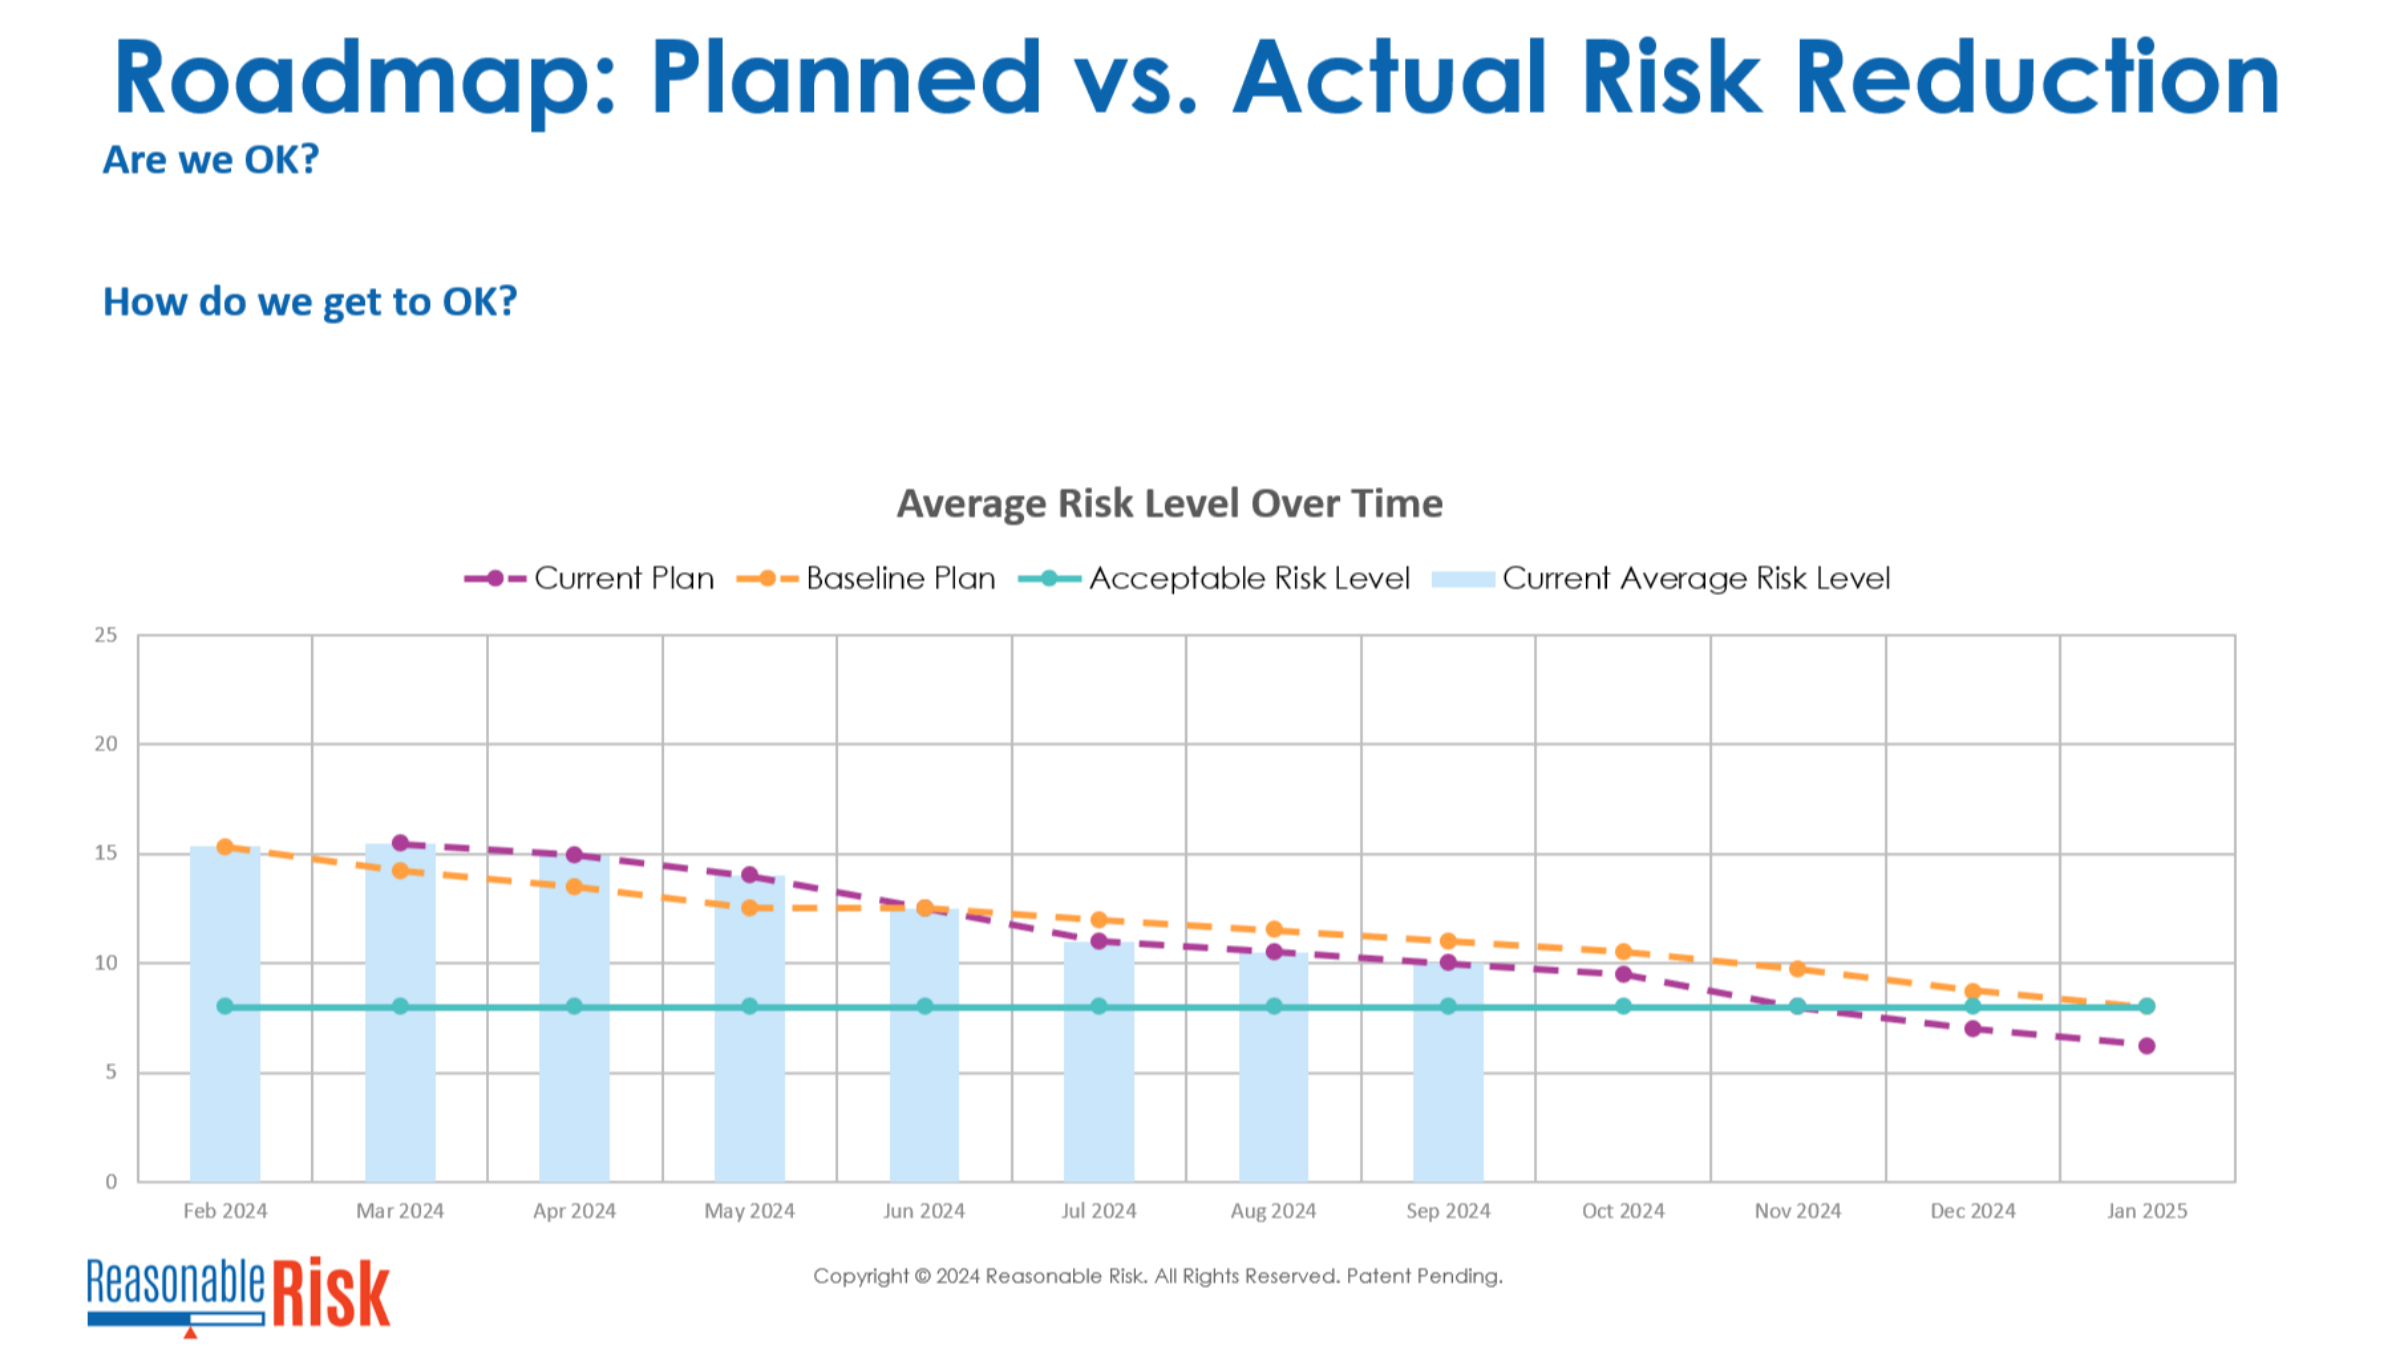
In this graph, we see 4 main things.
One - the blue rectangles represent the average risk score over time.
Two - the teal horizontal line is our acceptable risk - this is what our goal is.
Three - the brown line is our baseline plan, this is what is approved, and if we do everything on schedule, we will remediate risks and the risk average will go down on the schedule that is dictated by that brown line.
Four - the purple line is the current plan.
Of course, things don't always go perfectly, so this is actually what is happening.
This graph is an output of Reasonable Risk reports and is always online in the KPI Dashboard for continuous monitoring.
3. Final Analysis
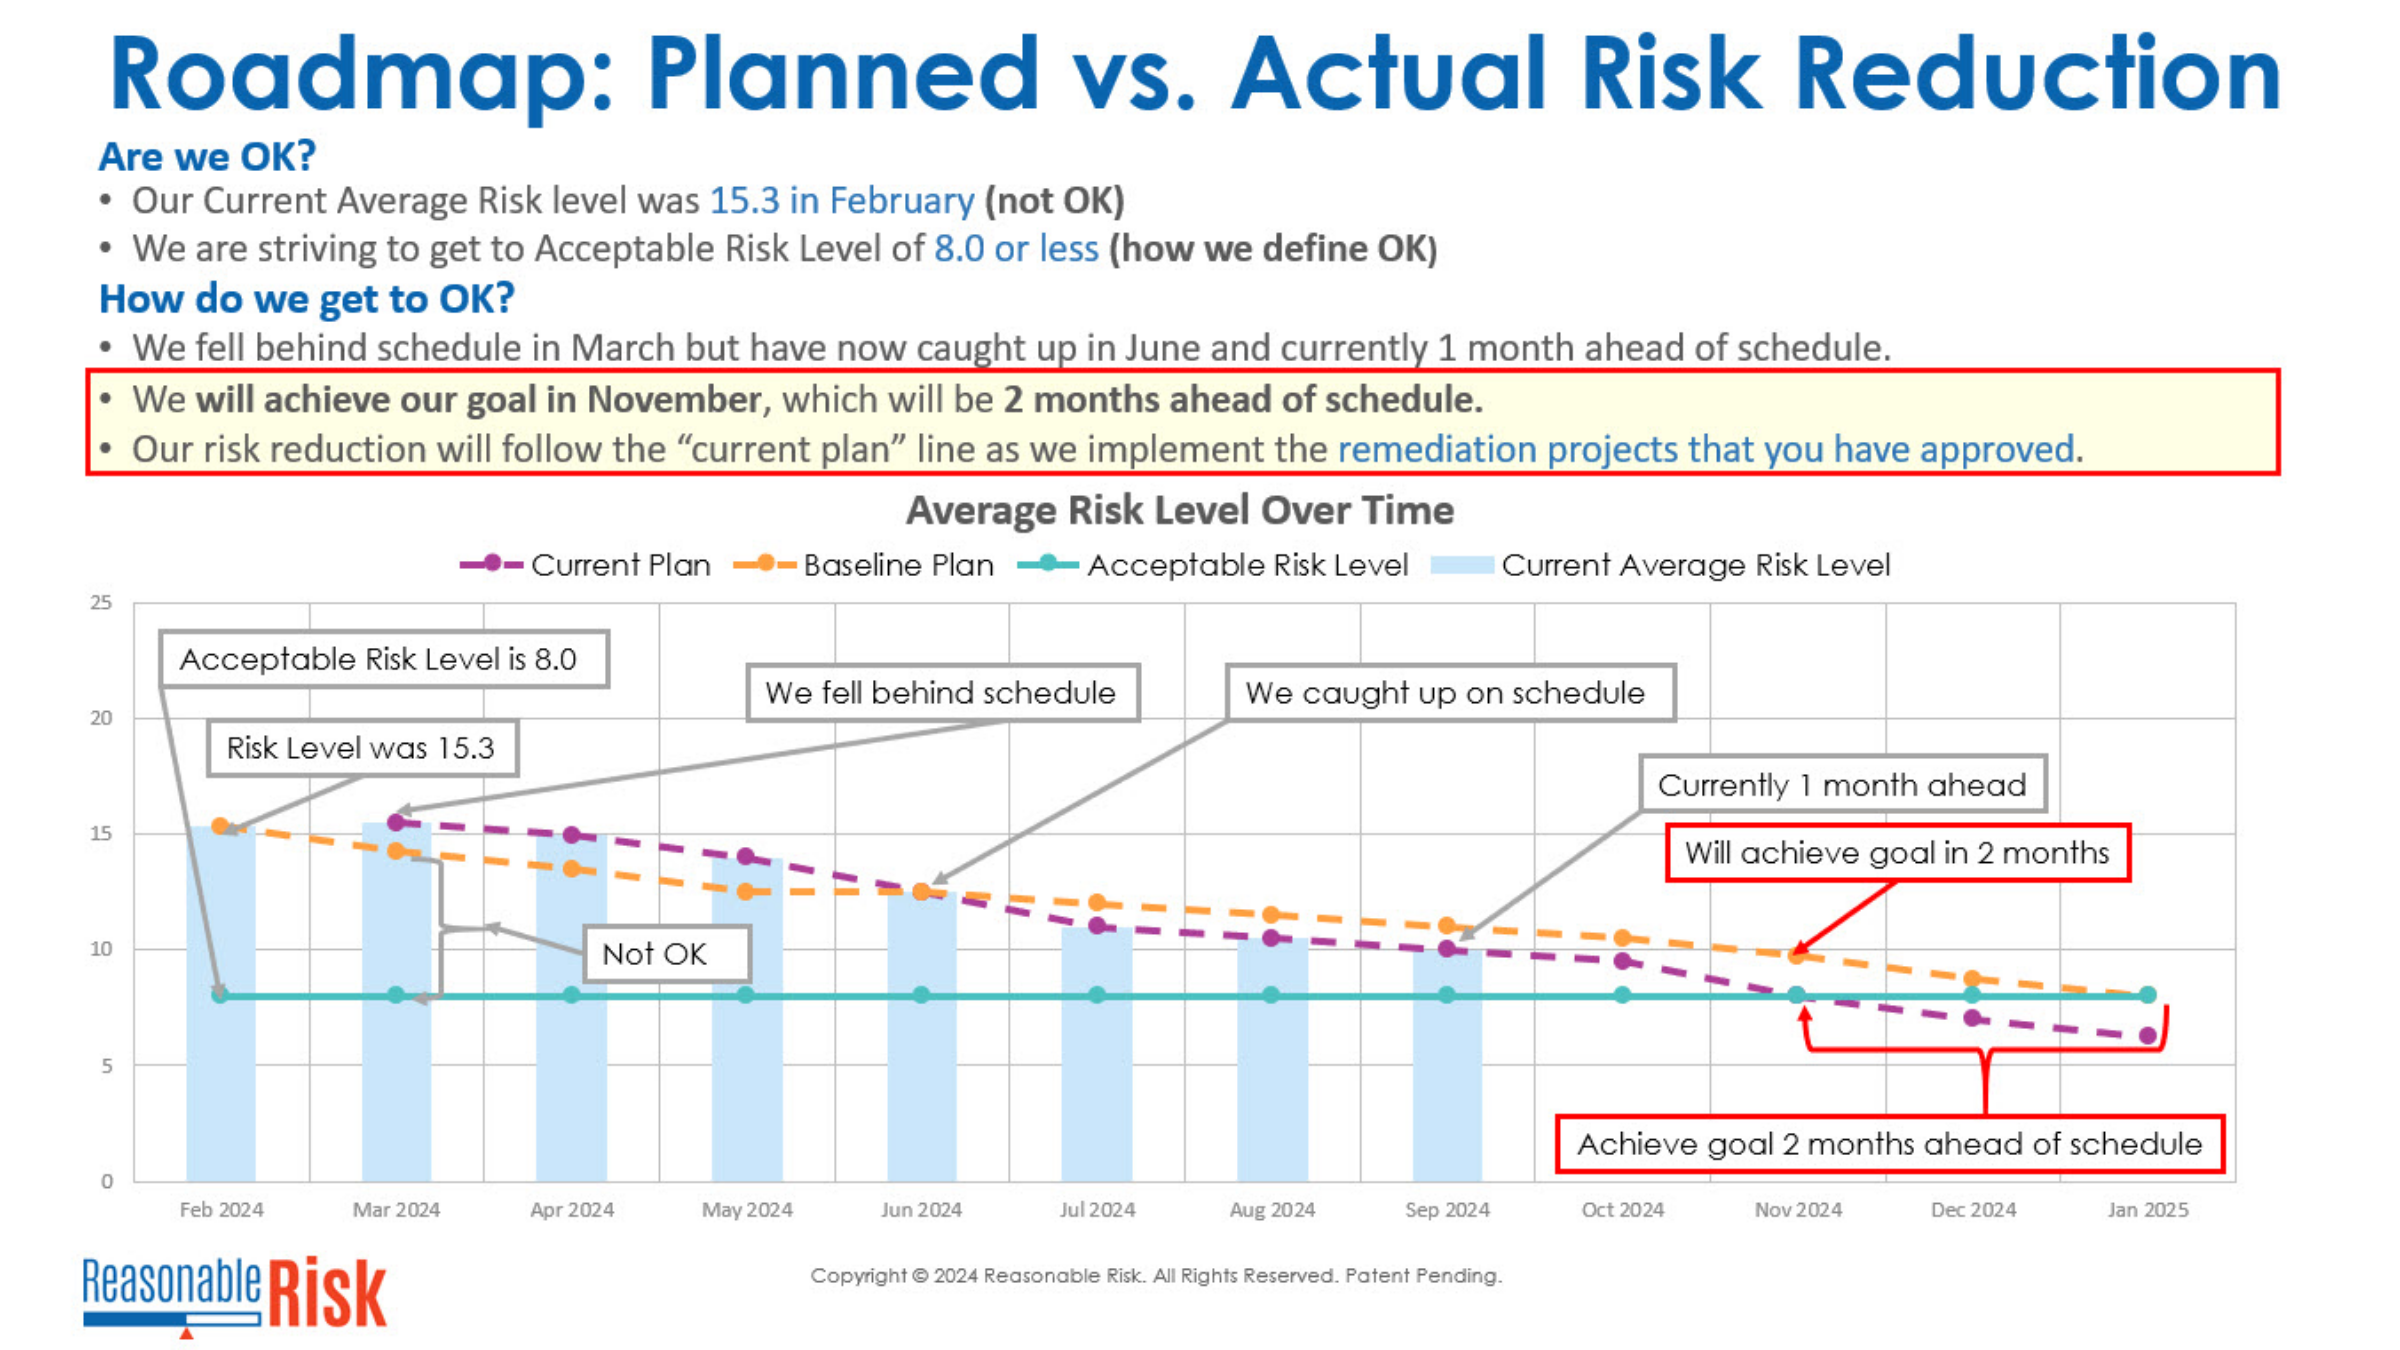
If we do some analysis here - we can see what has been happening.
In February, our risk level was 15.3 - we were not OK - as our goal risk is 8.0.
In March, we fell behind schedule, as shown by the purple line, which is the current plan, was above the baseline plan, which is the brown line.
However, in June, we caught up on schedule, and in September we are one month ahead of schedule. We are on schedule to being OK.
This model predicts, if we stay on plan, that we will achieve our goal of being OK 2 months ahead of schedule.
Again, this roadmap is automatically generated based on risks, projects, and tasks created within Reasonable Risk, and is always online for continuous review.
You will always know where you are on the roadmap, on the way to OK.
Comments
0 comments
Please sign in to leave a comment.