This quick look will provide guidance on how, using Reasonable Risk, you can provide executive-level program status so that the c-suite can make informed decisions.
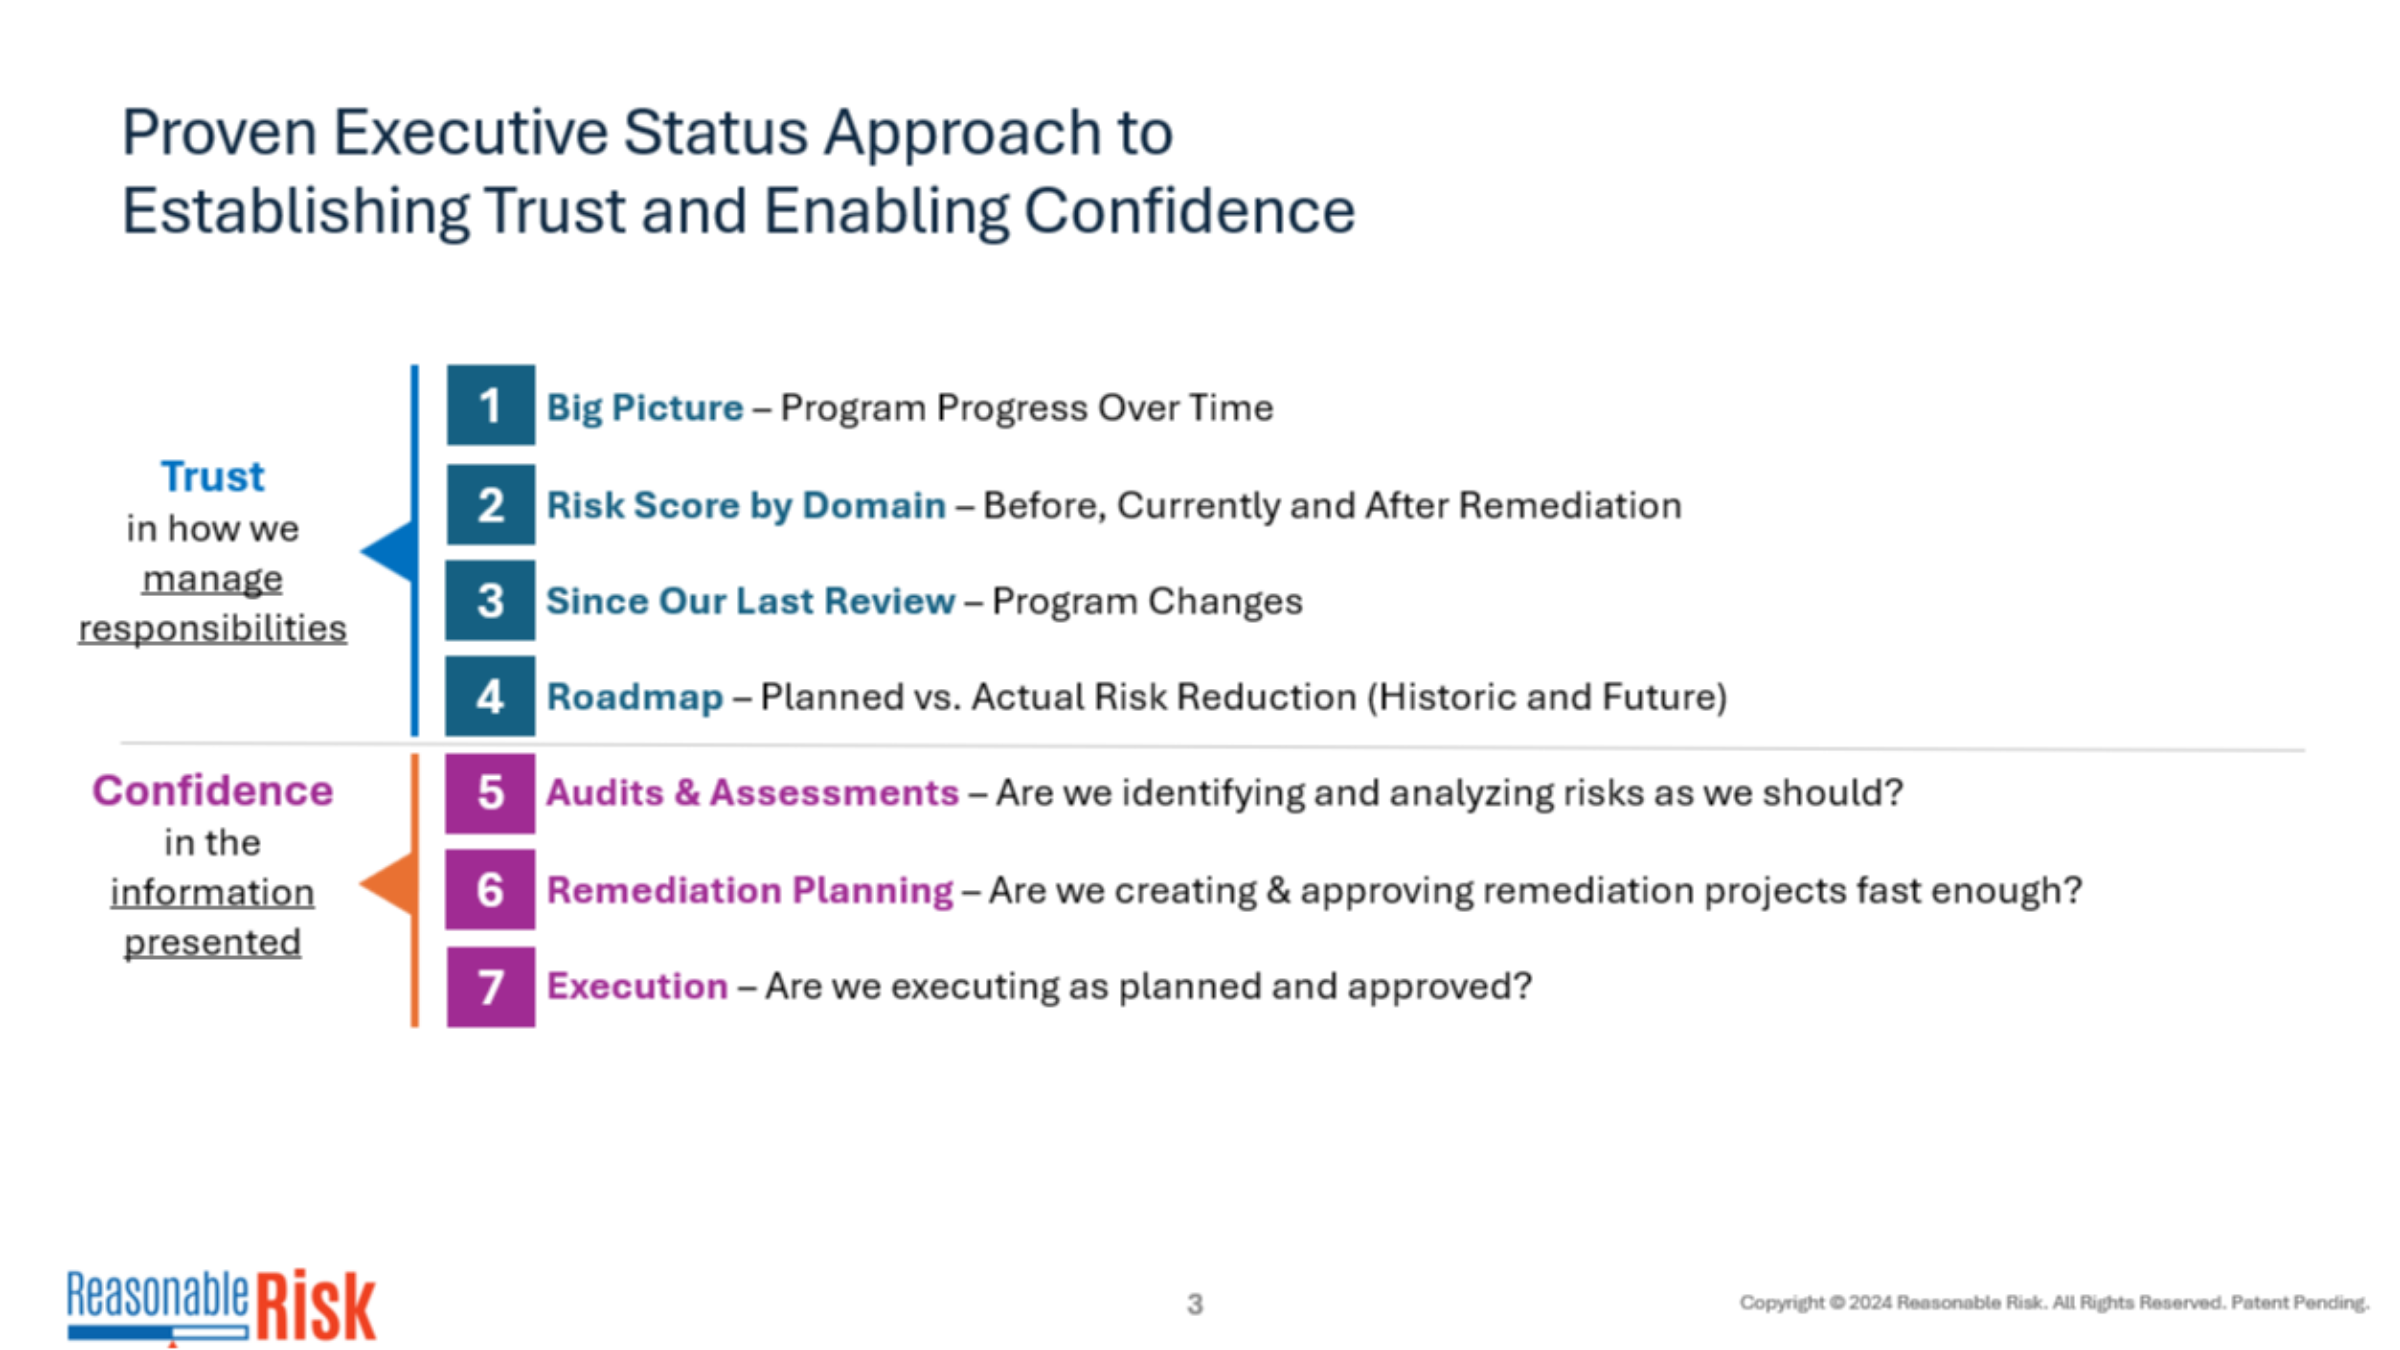
1. Establish Trust
The goal of any executive status is to establish trust - then we need to enable confidence. All of these elements are automatically produced in the executive status report that comes from Reasonable Risk.
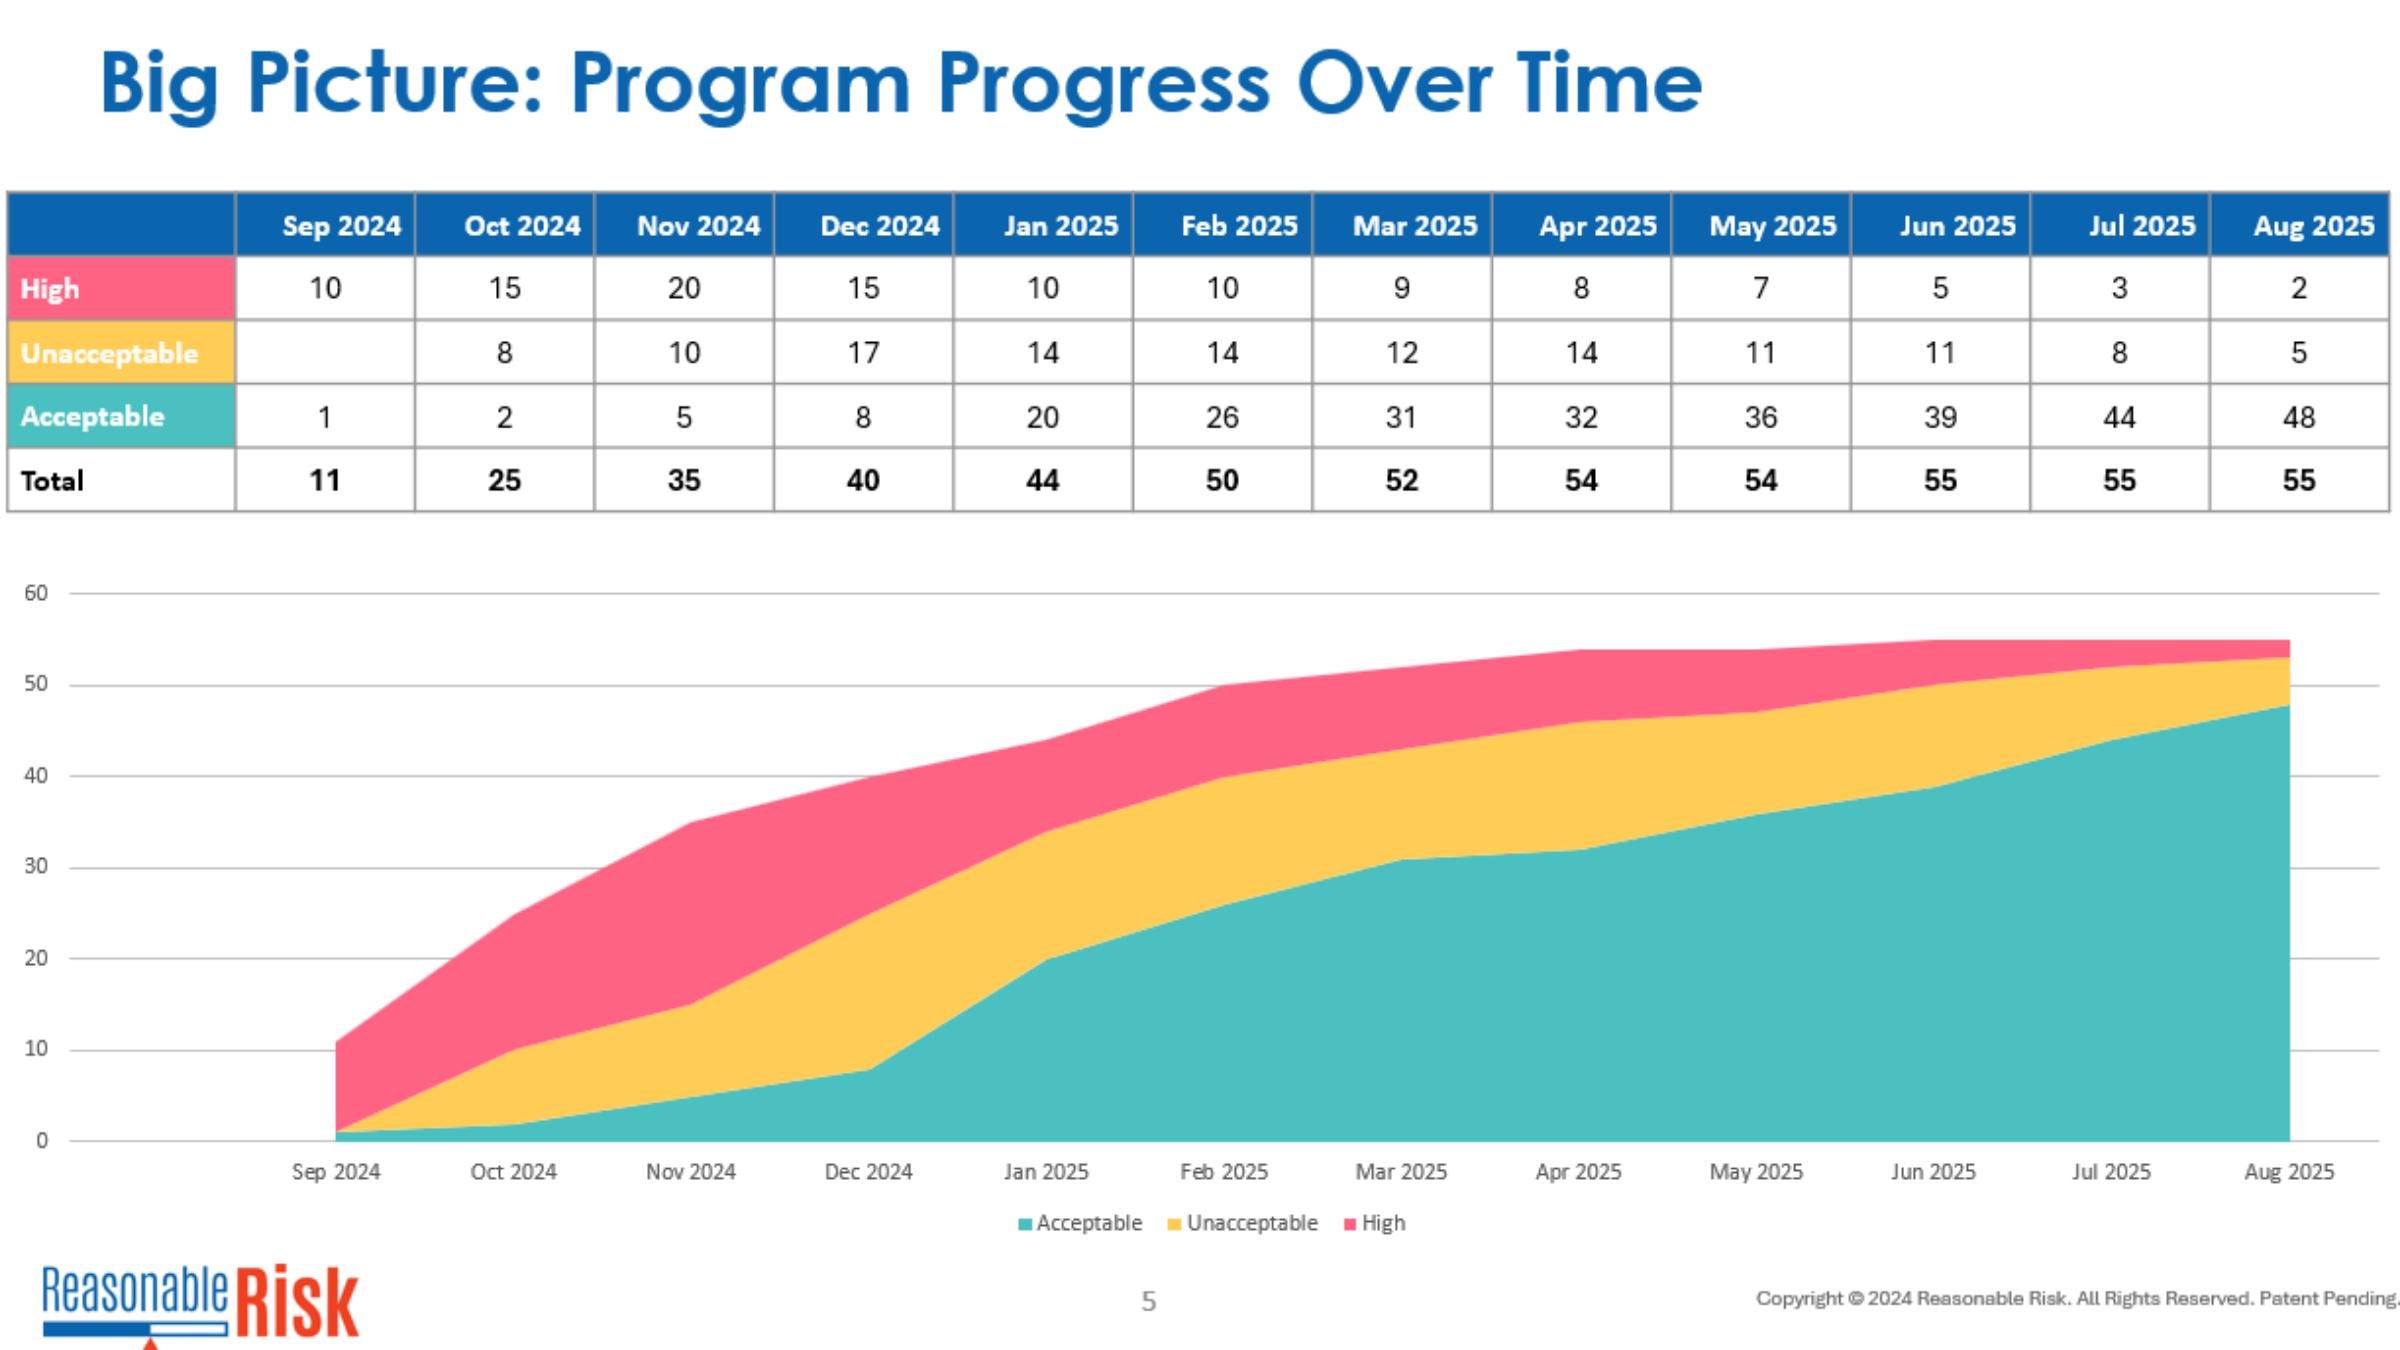
2. Progress Over Time
This Big Picture graph is part of the report, showing progress of risk levels over time. This example shows how the red, high risks are being reduced over time and transitioned to "Acceptable".
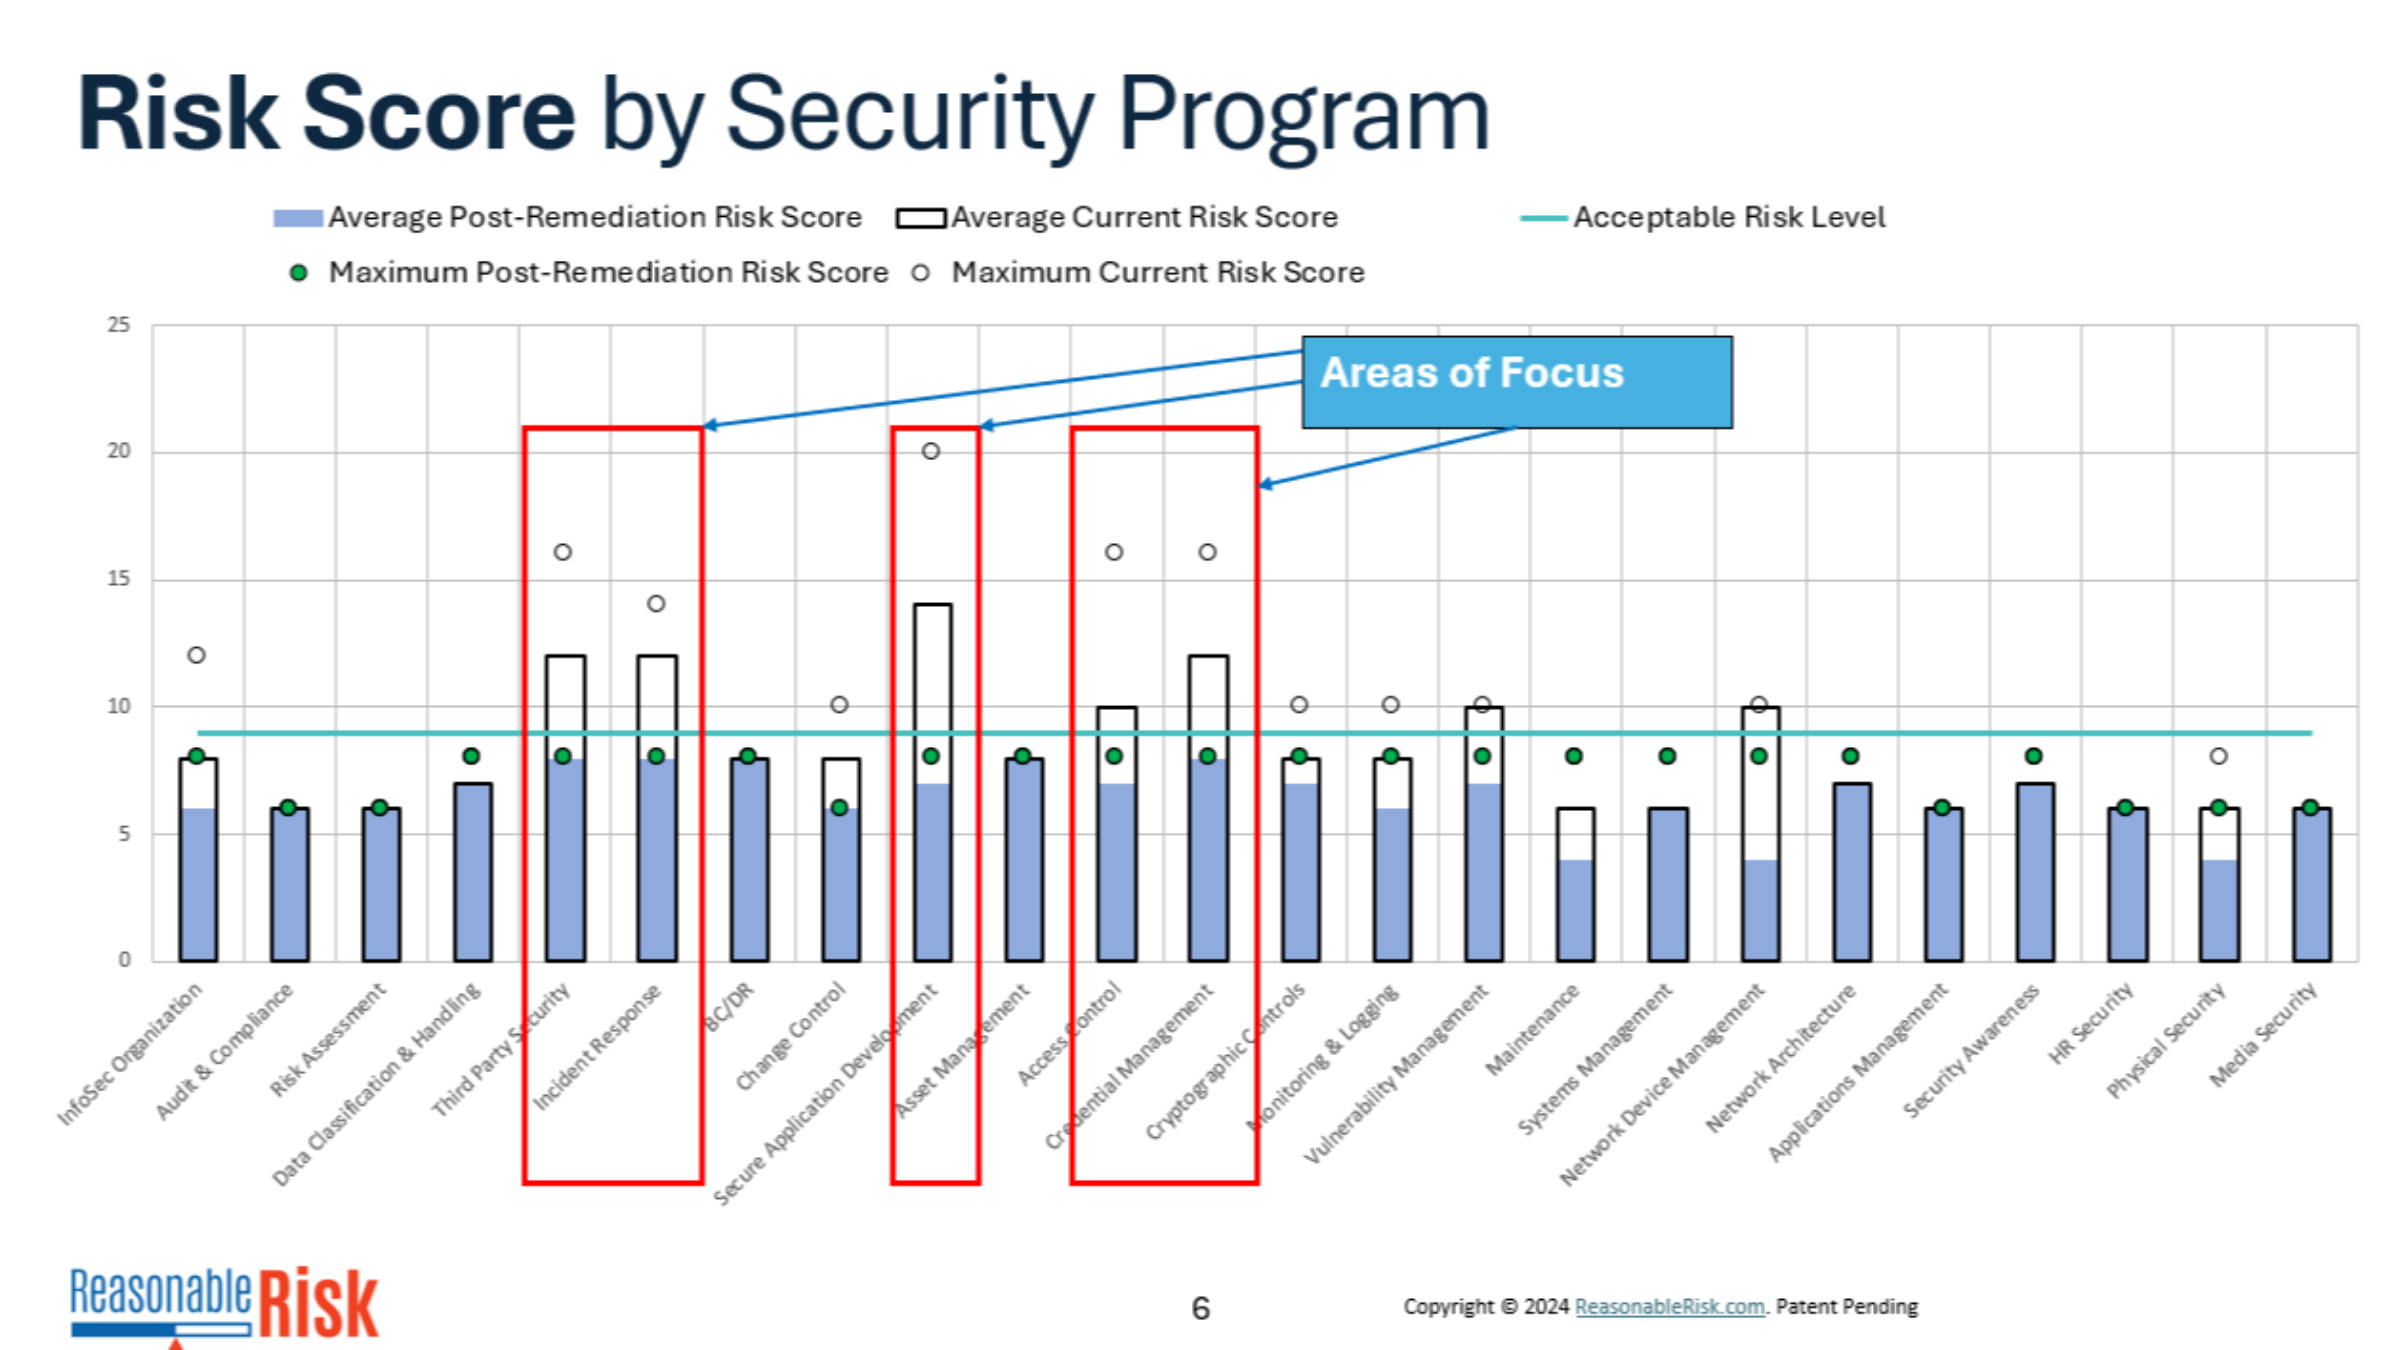
3. Risk Score by Program
The Risk Score by Security Program graph shows the risk score by Common Security Program.
The bars represent average risk scores and shows various states regarding them - such as current and post-remediation average risk score.
You can highlight key areas of focus in this editable PowerPoint - in this example we added red outlines around areas of focus.
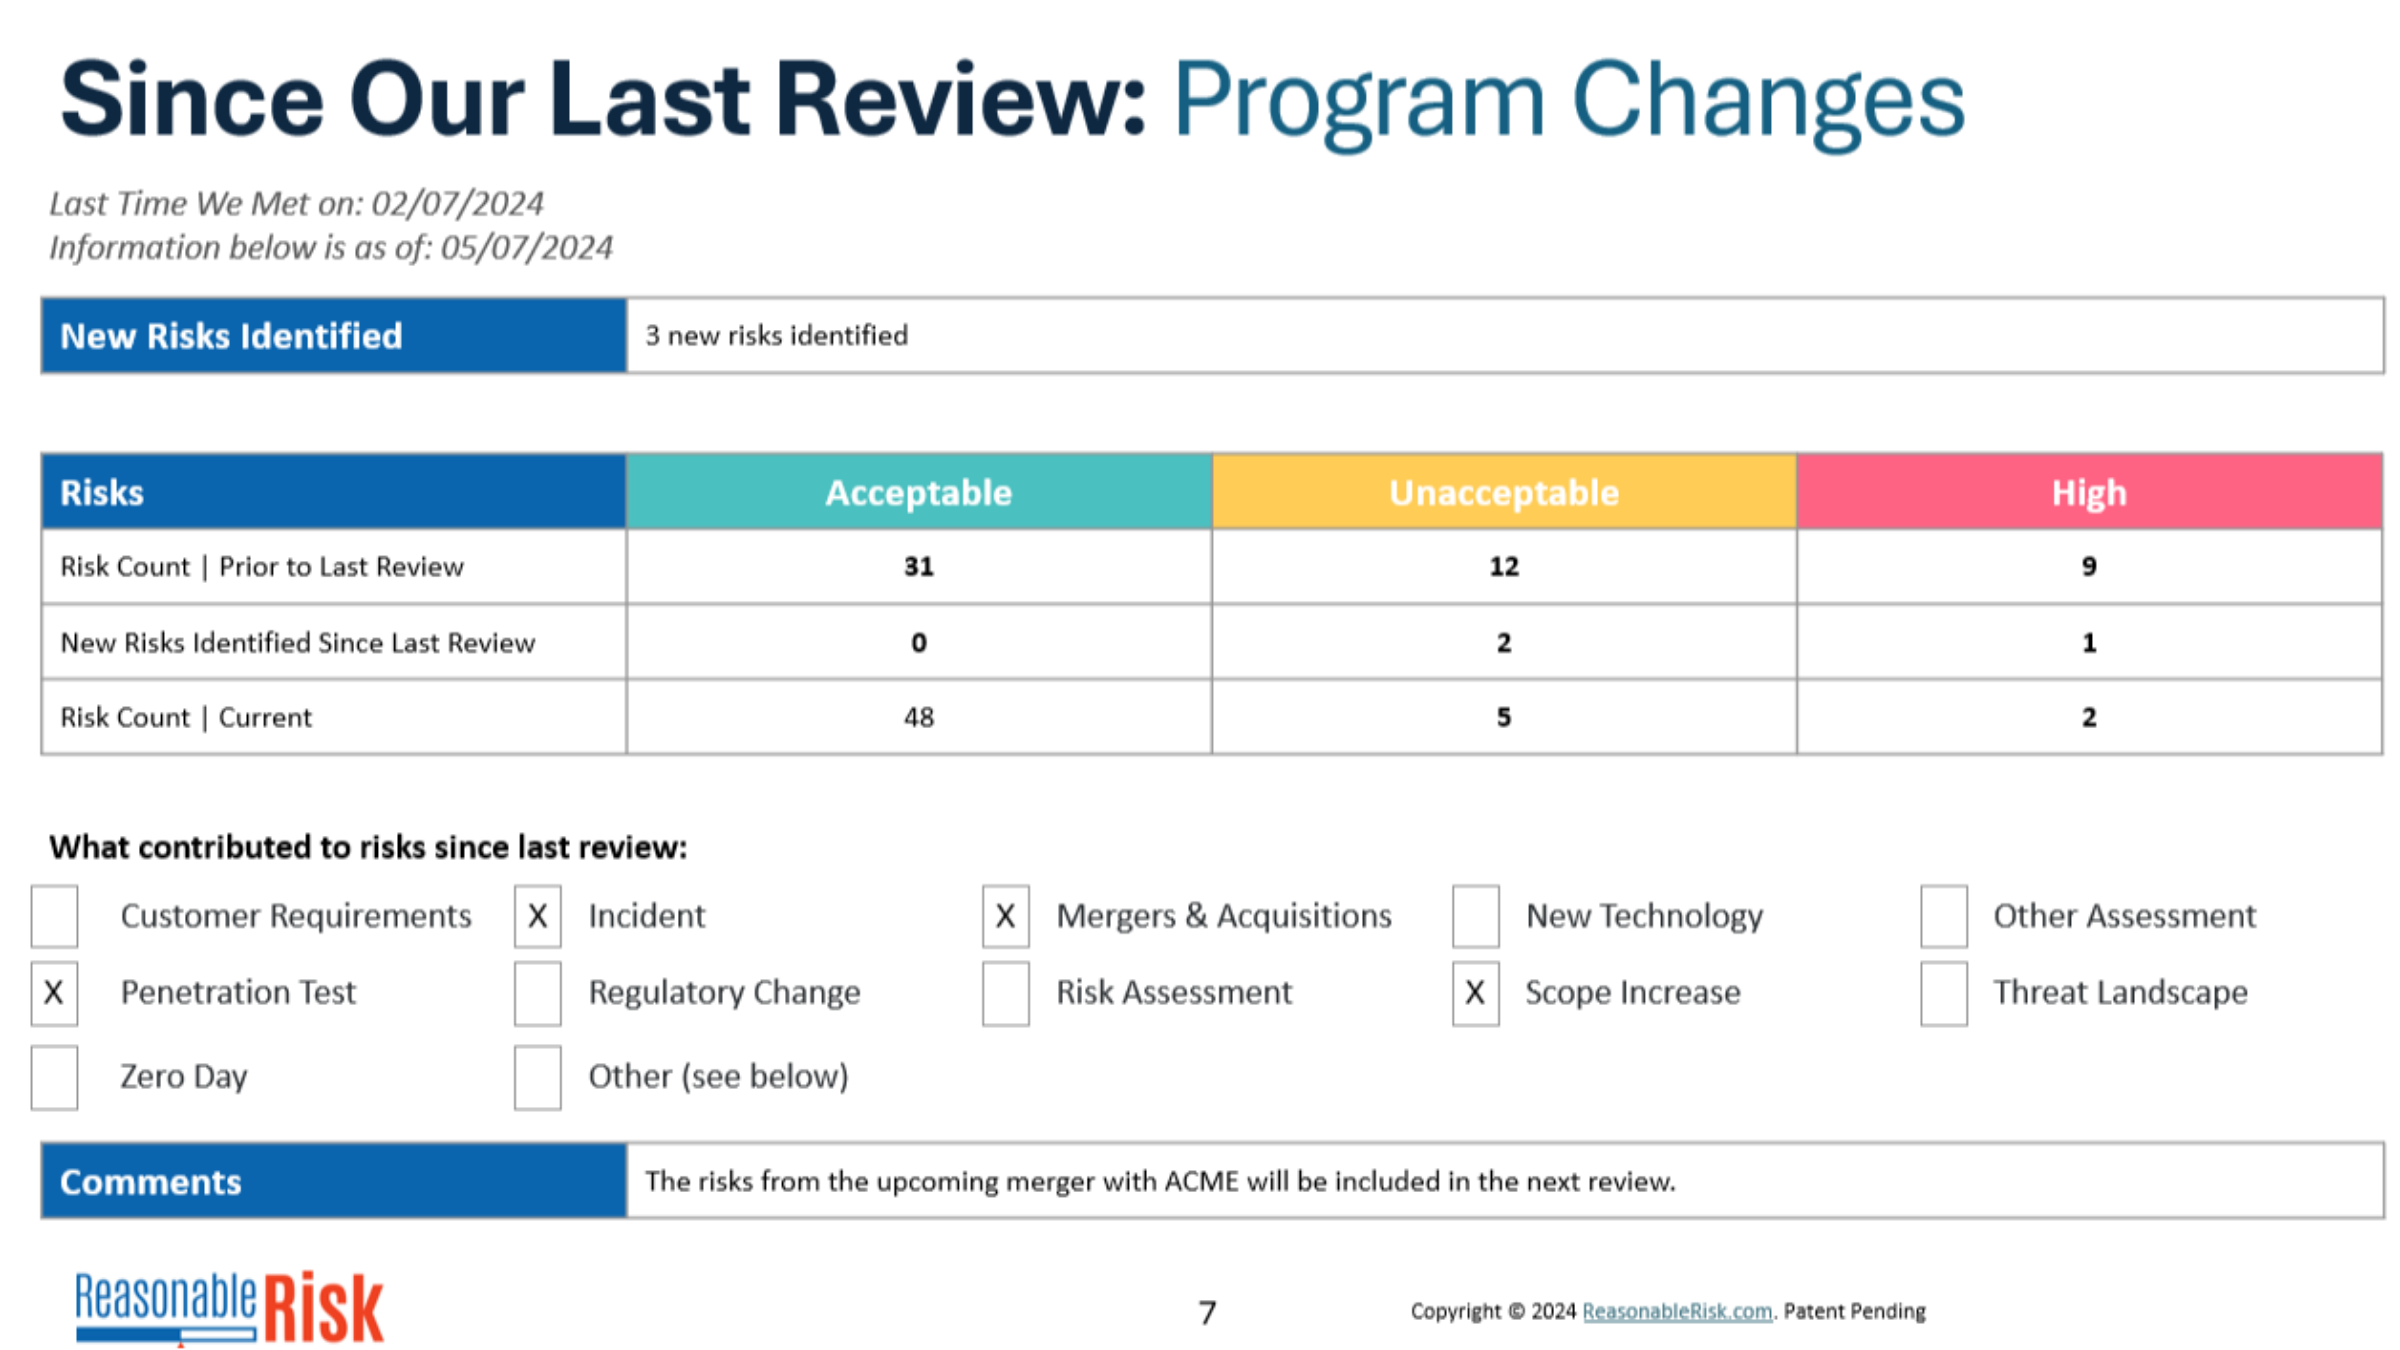
4. Since our Last Review
Respecting the audience - we show what happened since the last meeting. This is a quick summary of program changes that took place from the last time this group met.
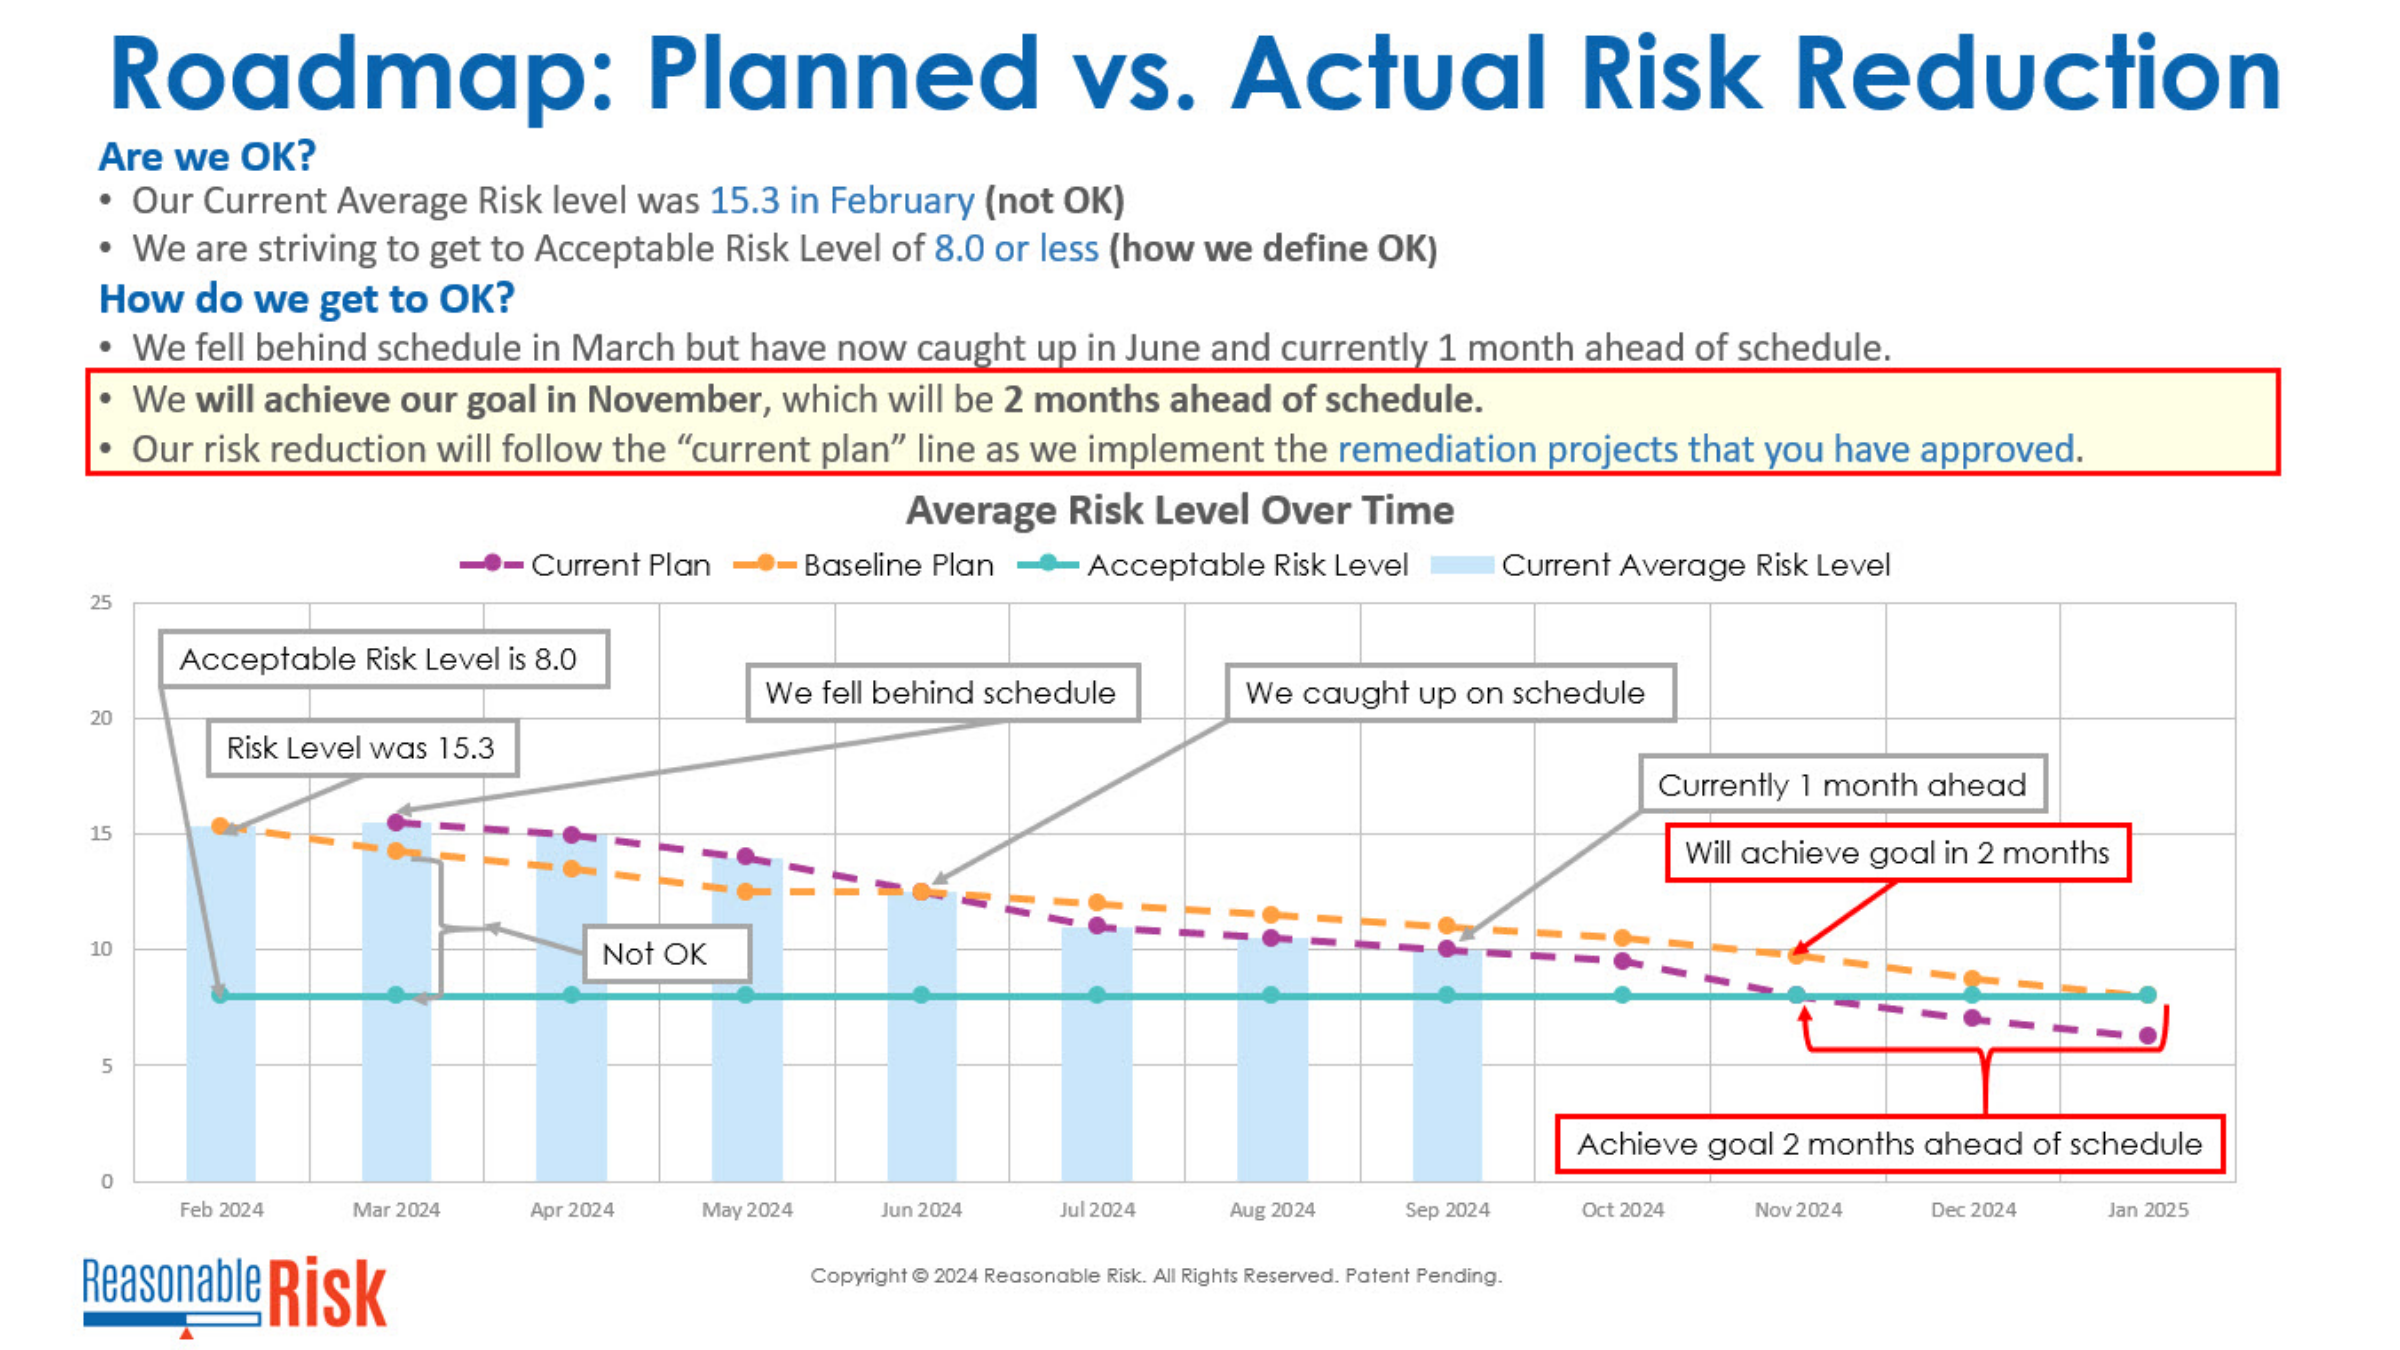
5. Roadmap
This robust roadmap slide shows the overall remediation plan, demonstrating when the program forecasts to achieve an acceptable level of risk. When that purple line - the current plan - goes below the horizontal blue line - the acceptable level of risk - that signifies that the organization is at an overall acceptable level of risk.
This was a quick look at only some of the slides in the executive status report. Contact your representative for more details. Thanks for watching!
Comments
0 comments
Please sign in to leave a comment.