This training module provides essential guidance on generating reports within the Reasonable Risk platform. We will explore how to create Budget Request and Executive Status presentations to effectively communicate risk management progress.
1. Focus Area: Run Reports
Welcome to the Reasonable Risk training module focused on running reports. This session will guide you through the process of generating key presentations, specifically the Budget Request and Executive Status reports, to help you effectively communicate risk management information.
2. Agenda: Run Reports
Our agenda today focuses on how to run reports.
3. Reasonable Risk Lifecycle Modules
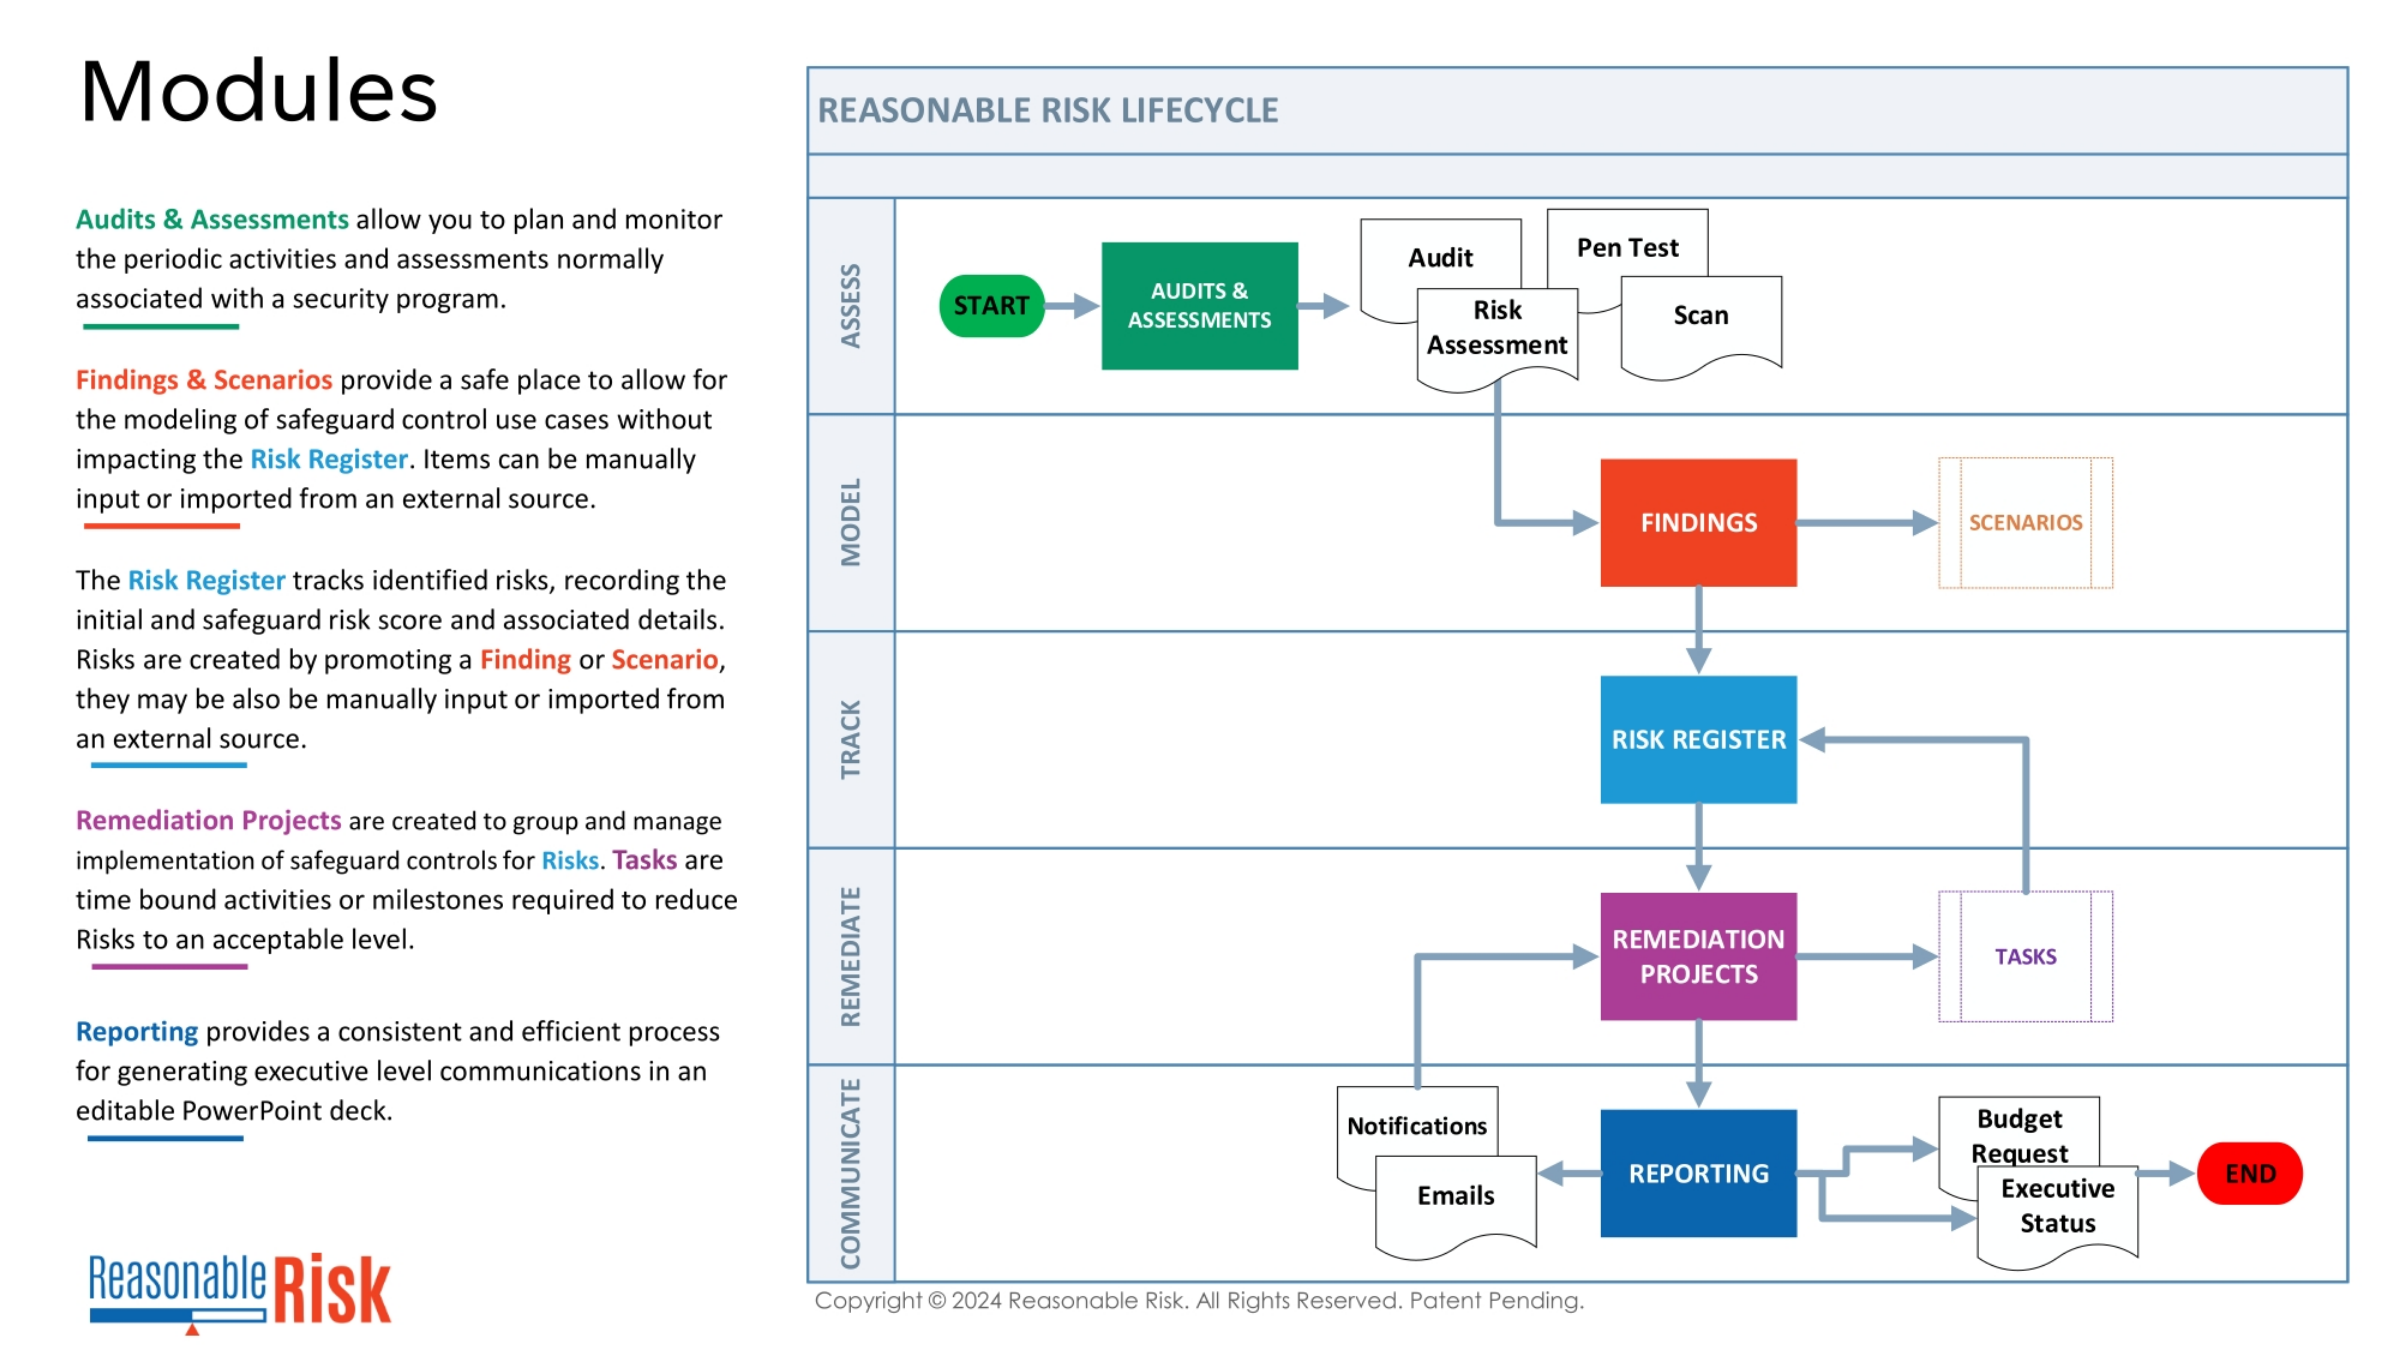
The Reasonable Risk platform is structured around a comprehensive lifecycle, starting with Audits and Assessments to monitor security activities. Findings and Scenarios allow for modeling safeguard control use cases without impacting the Risk Register, which tracks identified risks and their associated details. Remediation Projects are then created to manage the implementation of controls, with Tasks representing time-bound activities to reduce risks. Finally, Reporting provides a consistent and efficient process for generating executive-level communications in an editable PowerPoint deck, ensuring clear communication of risk posture and progress.
4. Modules with Presentation Generation Interface
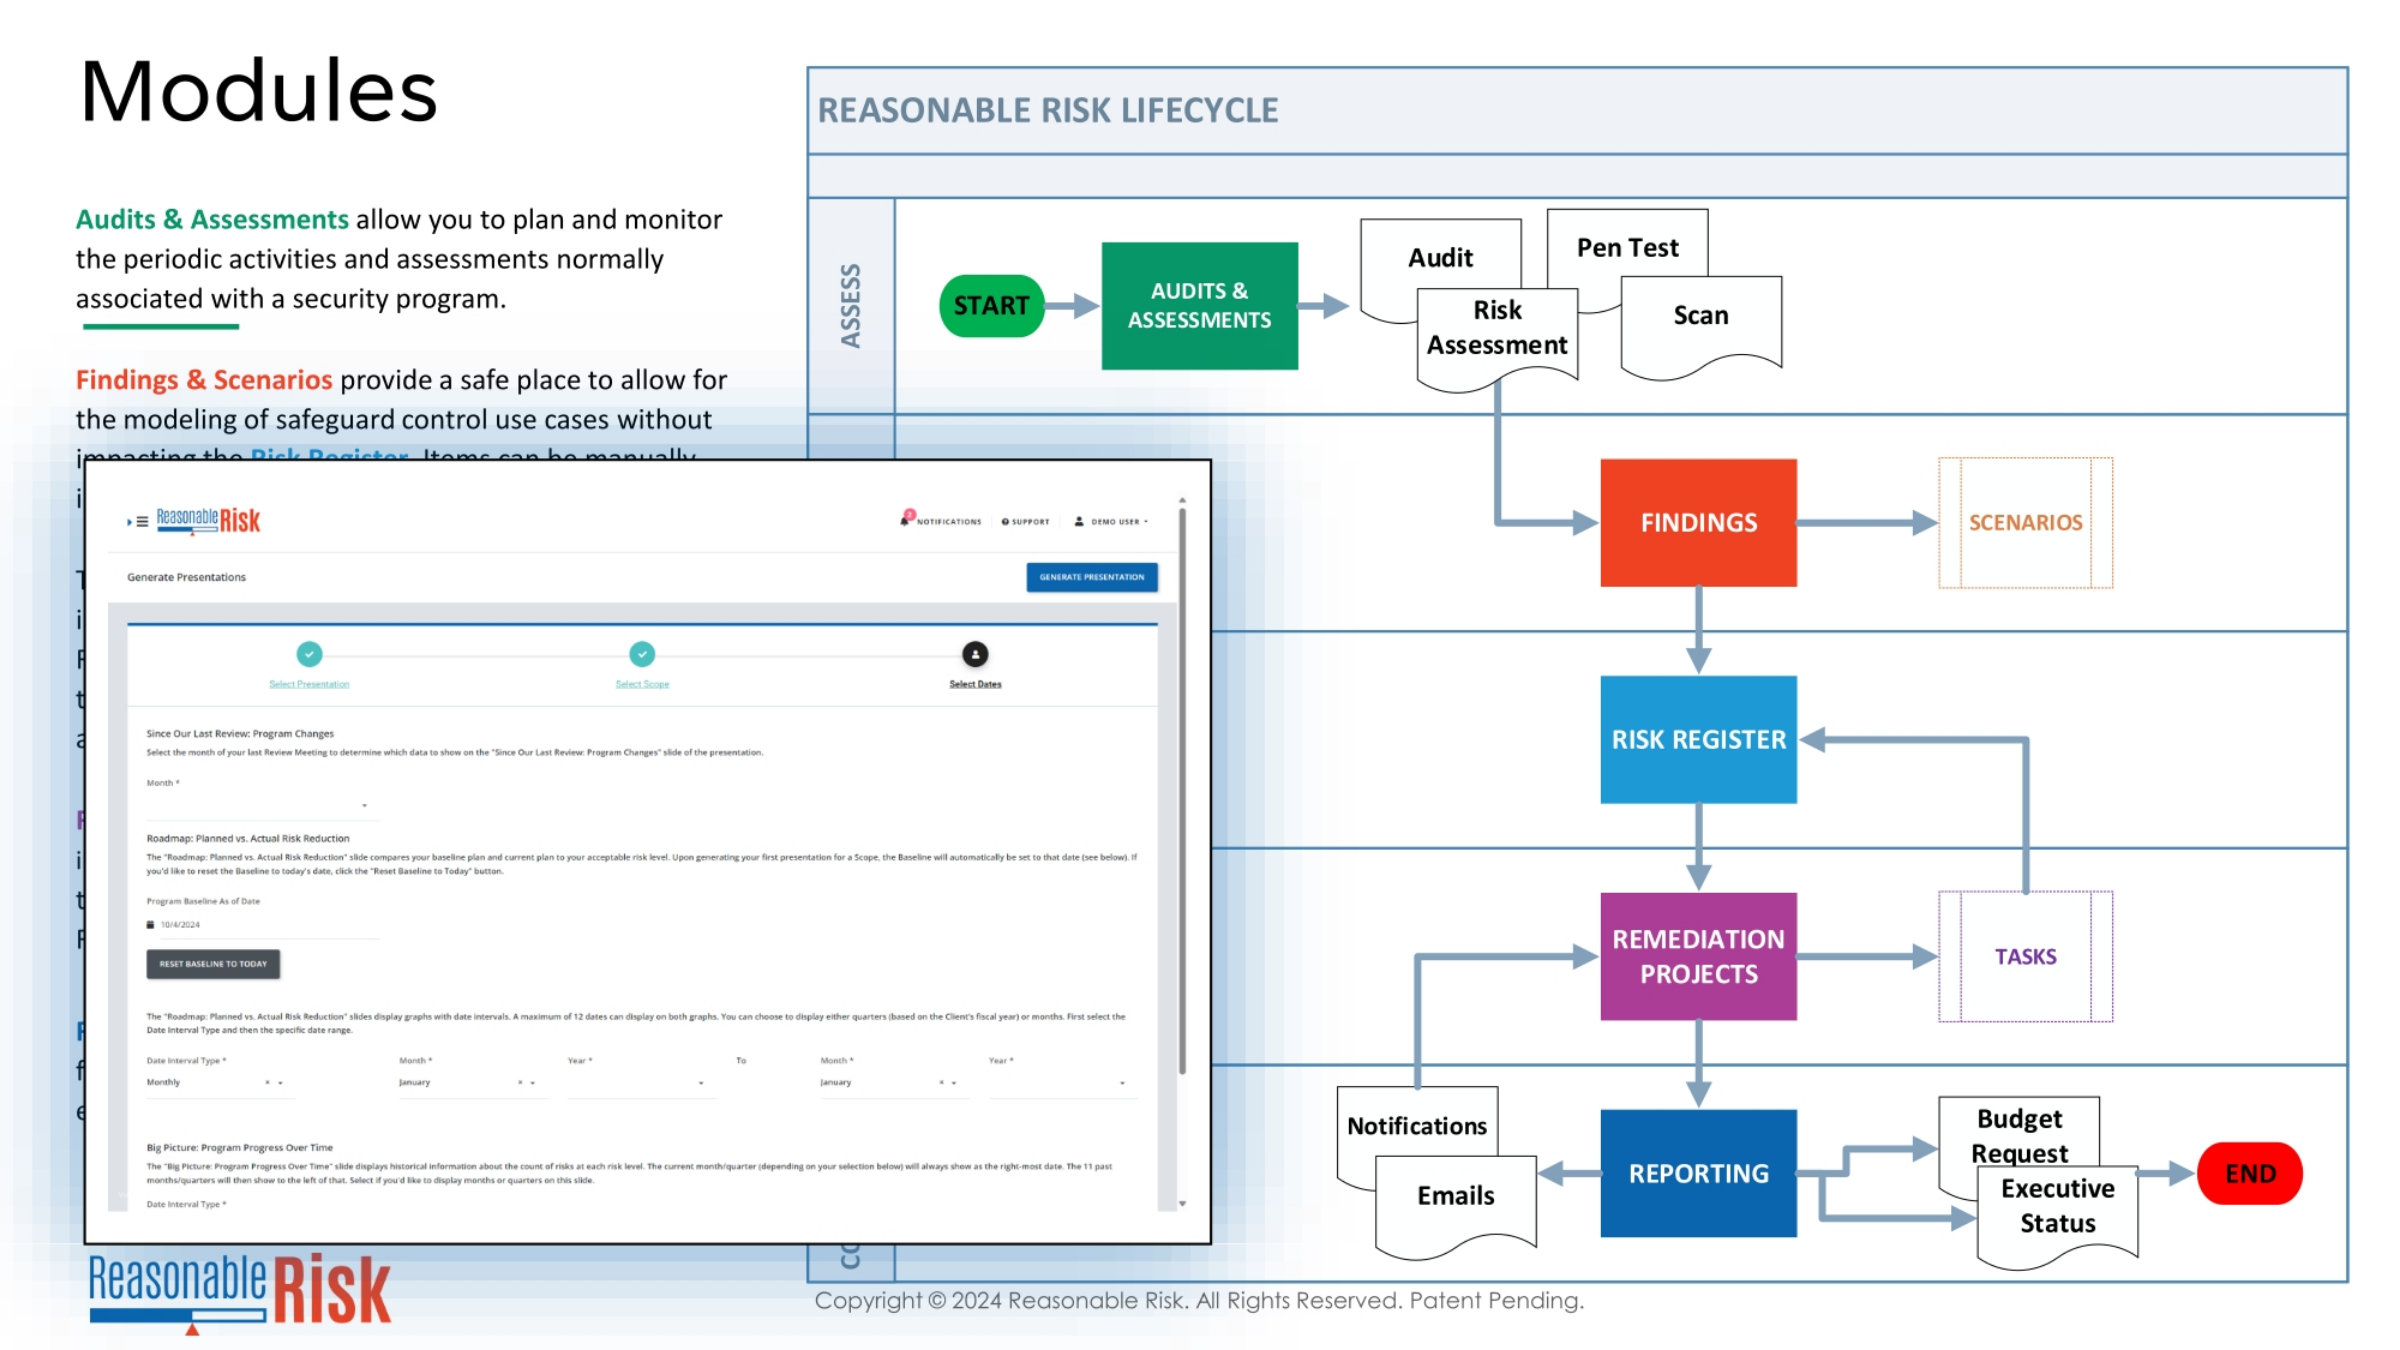
Building on our understanding of the Reasonable Risk modules, we now see how the "Generate Presentations" interface integrates into the overall lifecycle, specifically within the Reporting phase. This screen is where you will initiate the creation of your Budget Request and Executive Status presentations. It allows you to select various parameters, such as the month of your last review, to tailor the data displayed in your reports. This visual demonstrates the initial steps in configuring your presentation, ensuring the generated content aligns with your specific reporting needs.
5. Budget Request Report Objectives
Our objectives for the Budget Request Report are clear. First, we aim to understand the complete process of executing a budget request presentation. This involves not just generating the report, but also knowing how to effectively use it to secure funding for remediation projects. Second, we will delve into understanding all the individual slides that comprise this presentation. By grasping the purpose and content of each slide, you can ensure your budget requests are comprehensive, compelling, and ultimately successful in gaining the necessary resources for risk mitigation.
6. Executive Status Report Objectives
For the Executive Status Report, our objectives are similar yet distinct. We will focus on understanding how to execute an executive status presentation, which is crucial for periodic communication with stakeholders. This involves presenting project status and risk posture in a clear, concise manner. Furthermore, we will explore all the slides within this presentation, ensuring you know how to interpret and utilize each section to provide a comprehensive overview. The goal is to facilitate informed decision-making and maintain transparency regarding ongoing risk management efforts.
7. Generate Presentations Screen Narrative
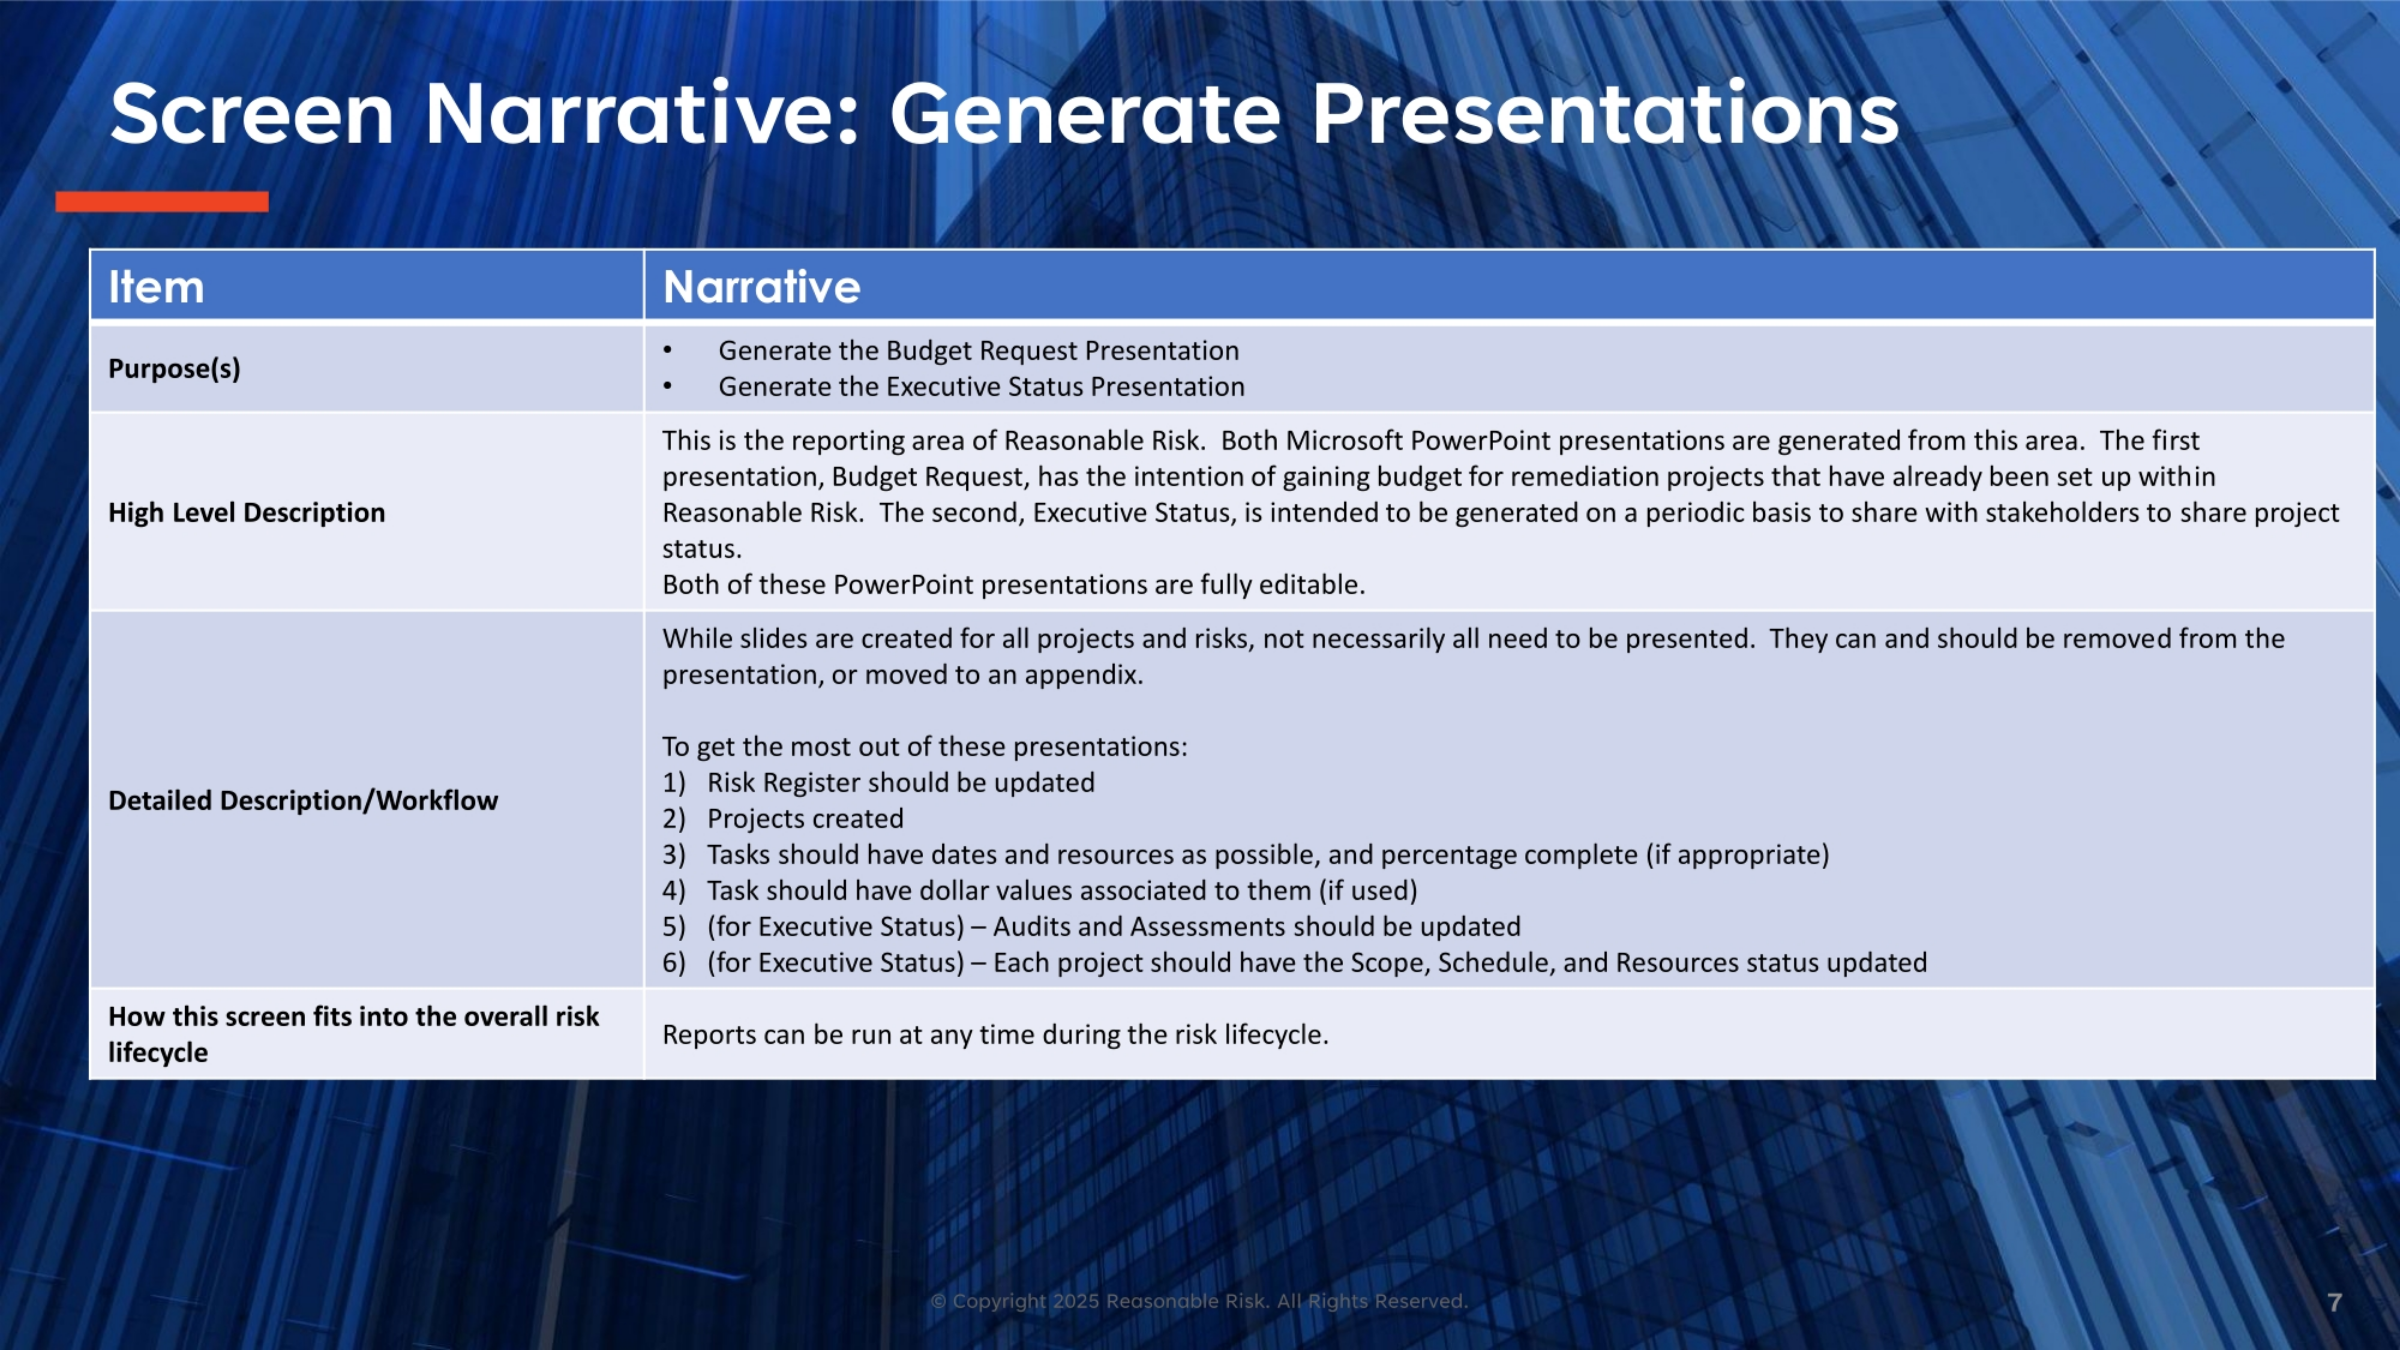
The "Generate Presentations" screen serves as the central reporting area within Reasonable Risk, enabling the creation of both Budget Request and Executive Status PowerPoint presentations. The Budget Request presentation aims to secure funding for remediation projects, while the Executive Status report provides periodic project updates to stakeholders. Both generated presentations are fully editable, allowing for customization. To maximize their effectiveness, ensure your Risk Register is updated, projects and tasks are created with relevant details, and for Executive Status, audits, assessments, scope, schedule, and resources are current. Reports can be run at any point in the risk lifecycle.
8. Generate Presentations Wizard Visual
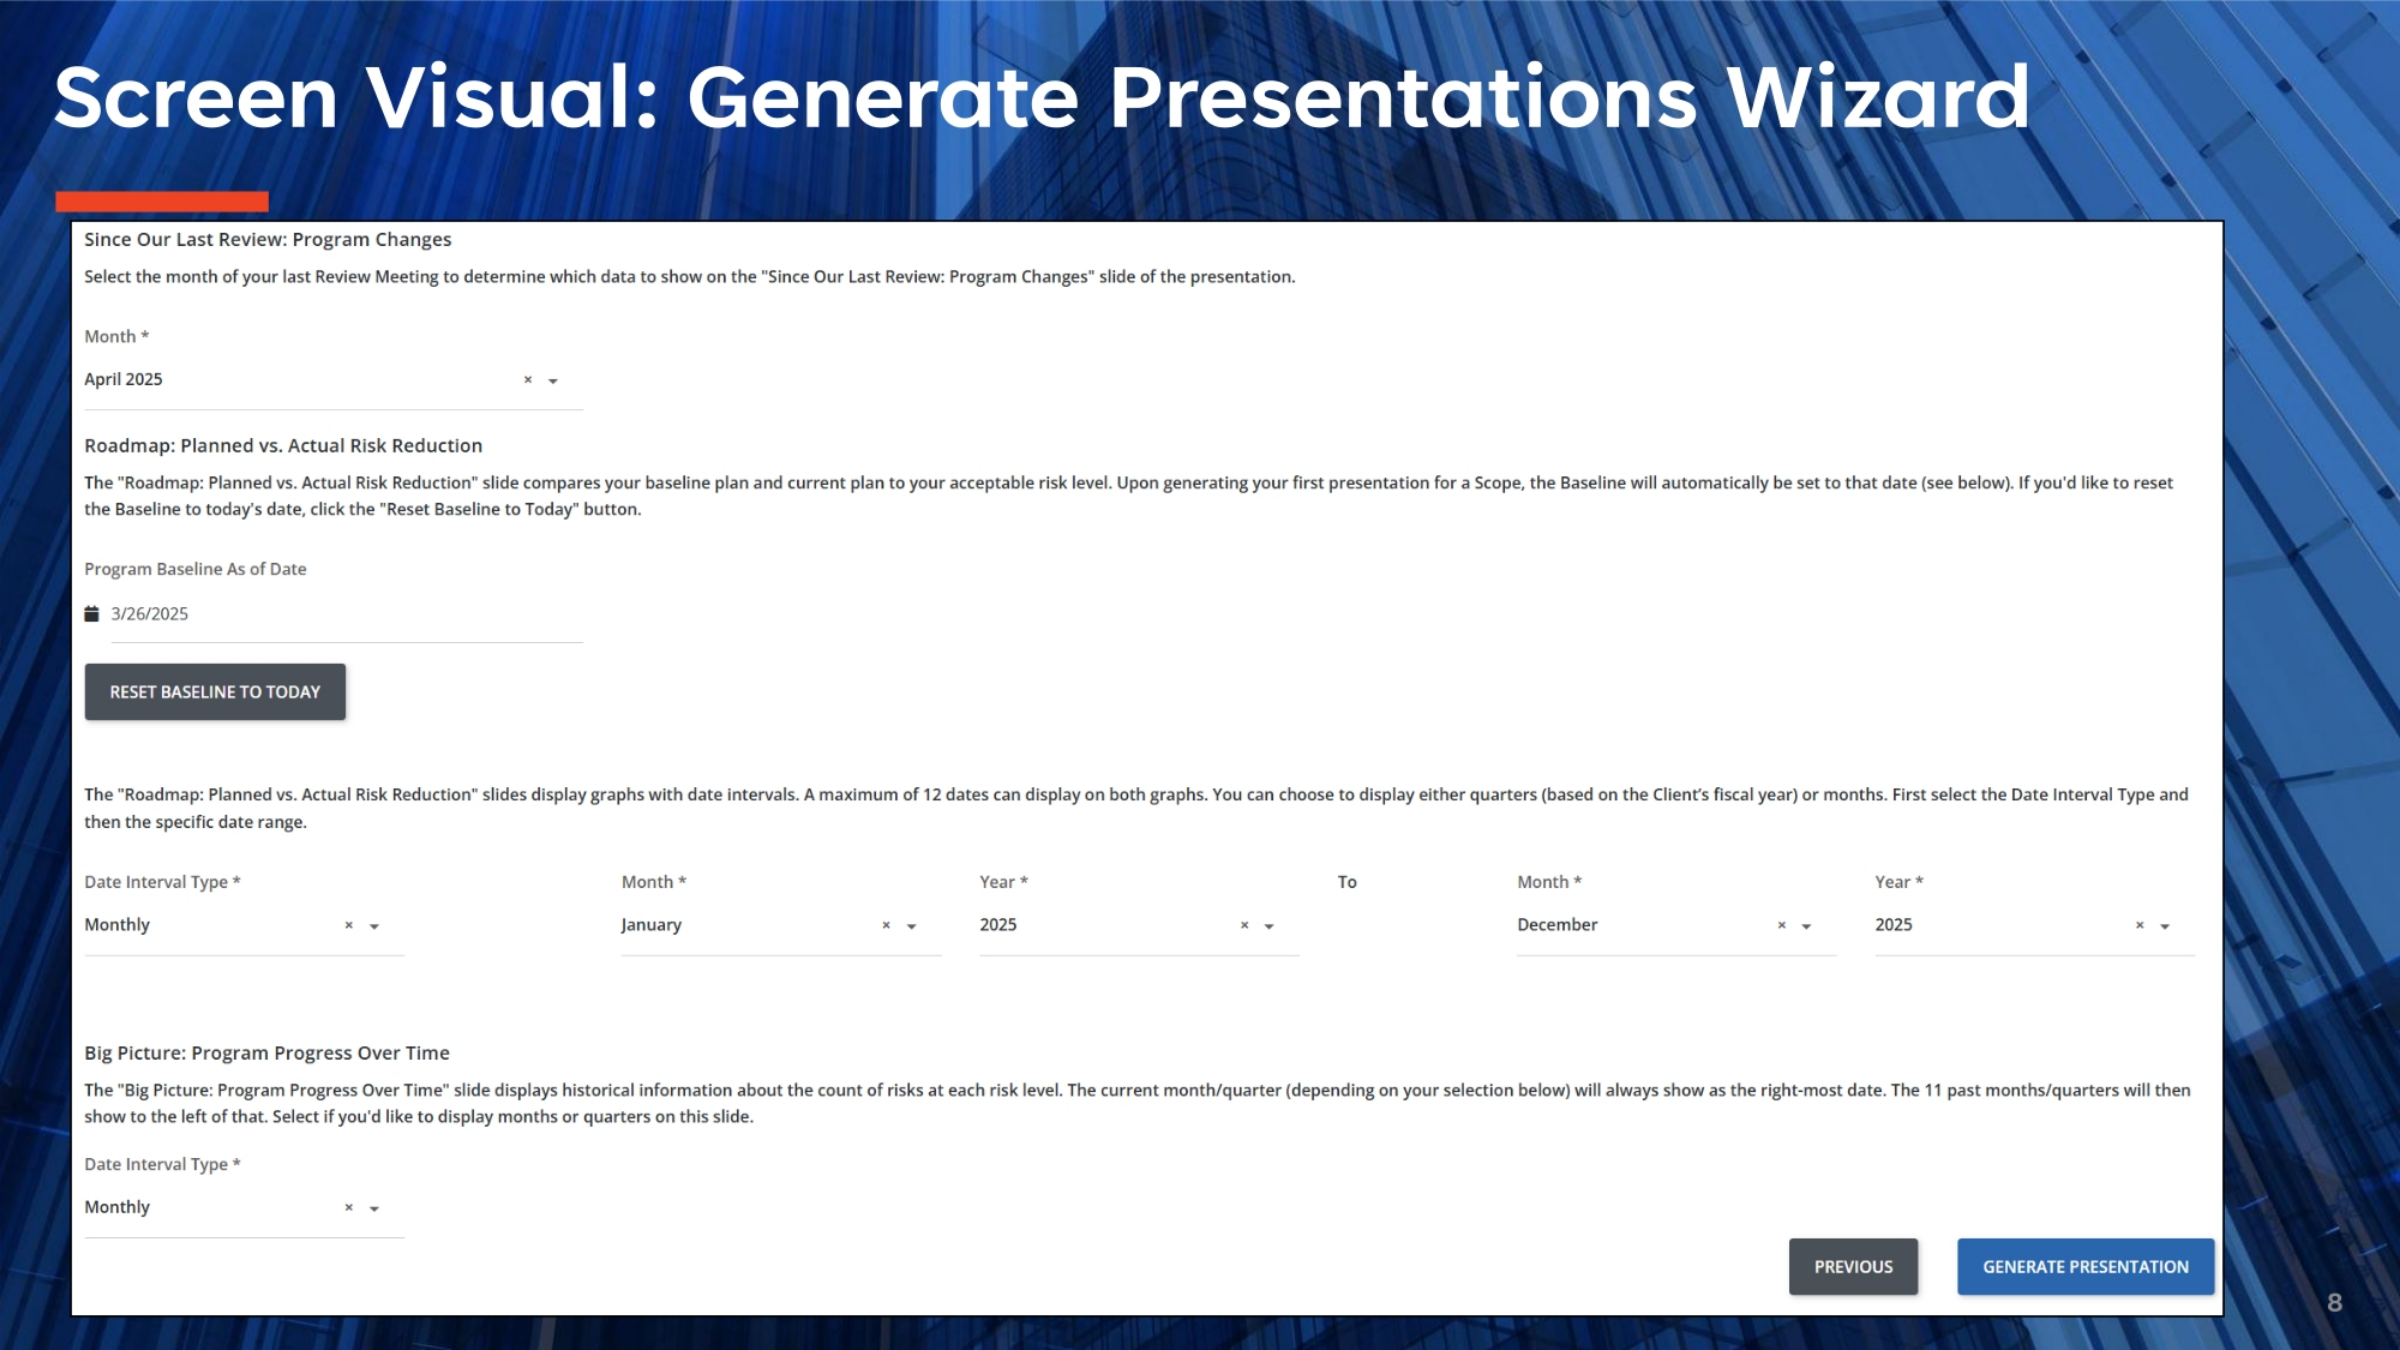
This visual represents the "Generate Presentations Wizard," the interface where you configure your reports. Key sections include "Since Our Last Review: Program Changes," where you select the month for data display, and "Roadmap: Planned vs. Actual Risk Reduction," which compares your baseline and current risk levels. You can reset the baseline if needed. The wizard also allows you to define date intervals for graphs, choosing between monthly or quarterly views, with a maximum of 12 periods. Finally, the "Big Picture: Program Progress Over Time" section displays historical risk level counts, providing a comprehensive overview of your program's evolution.
9. Generate Presentations Screen Review
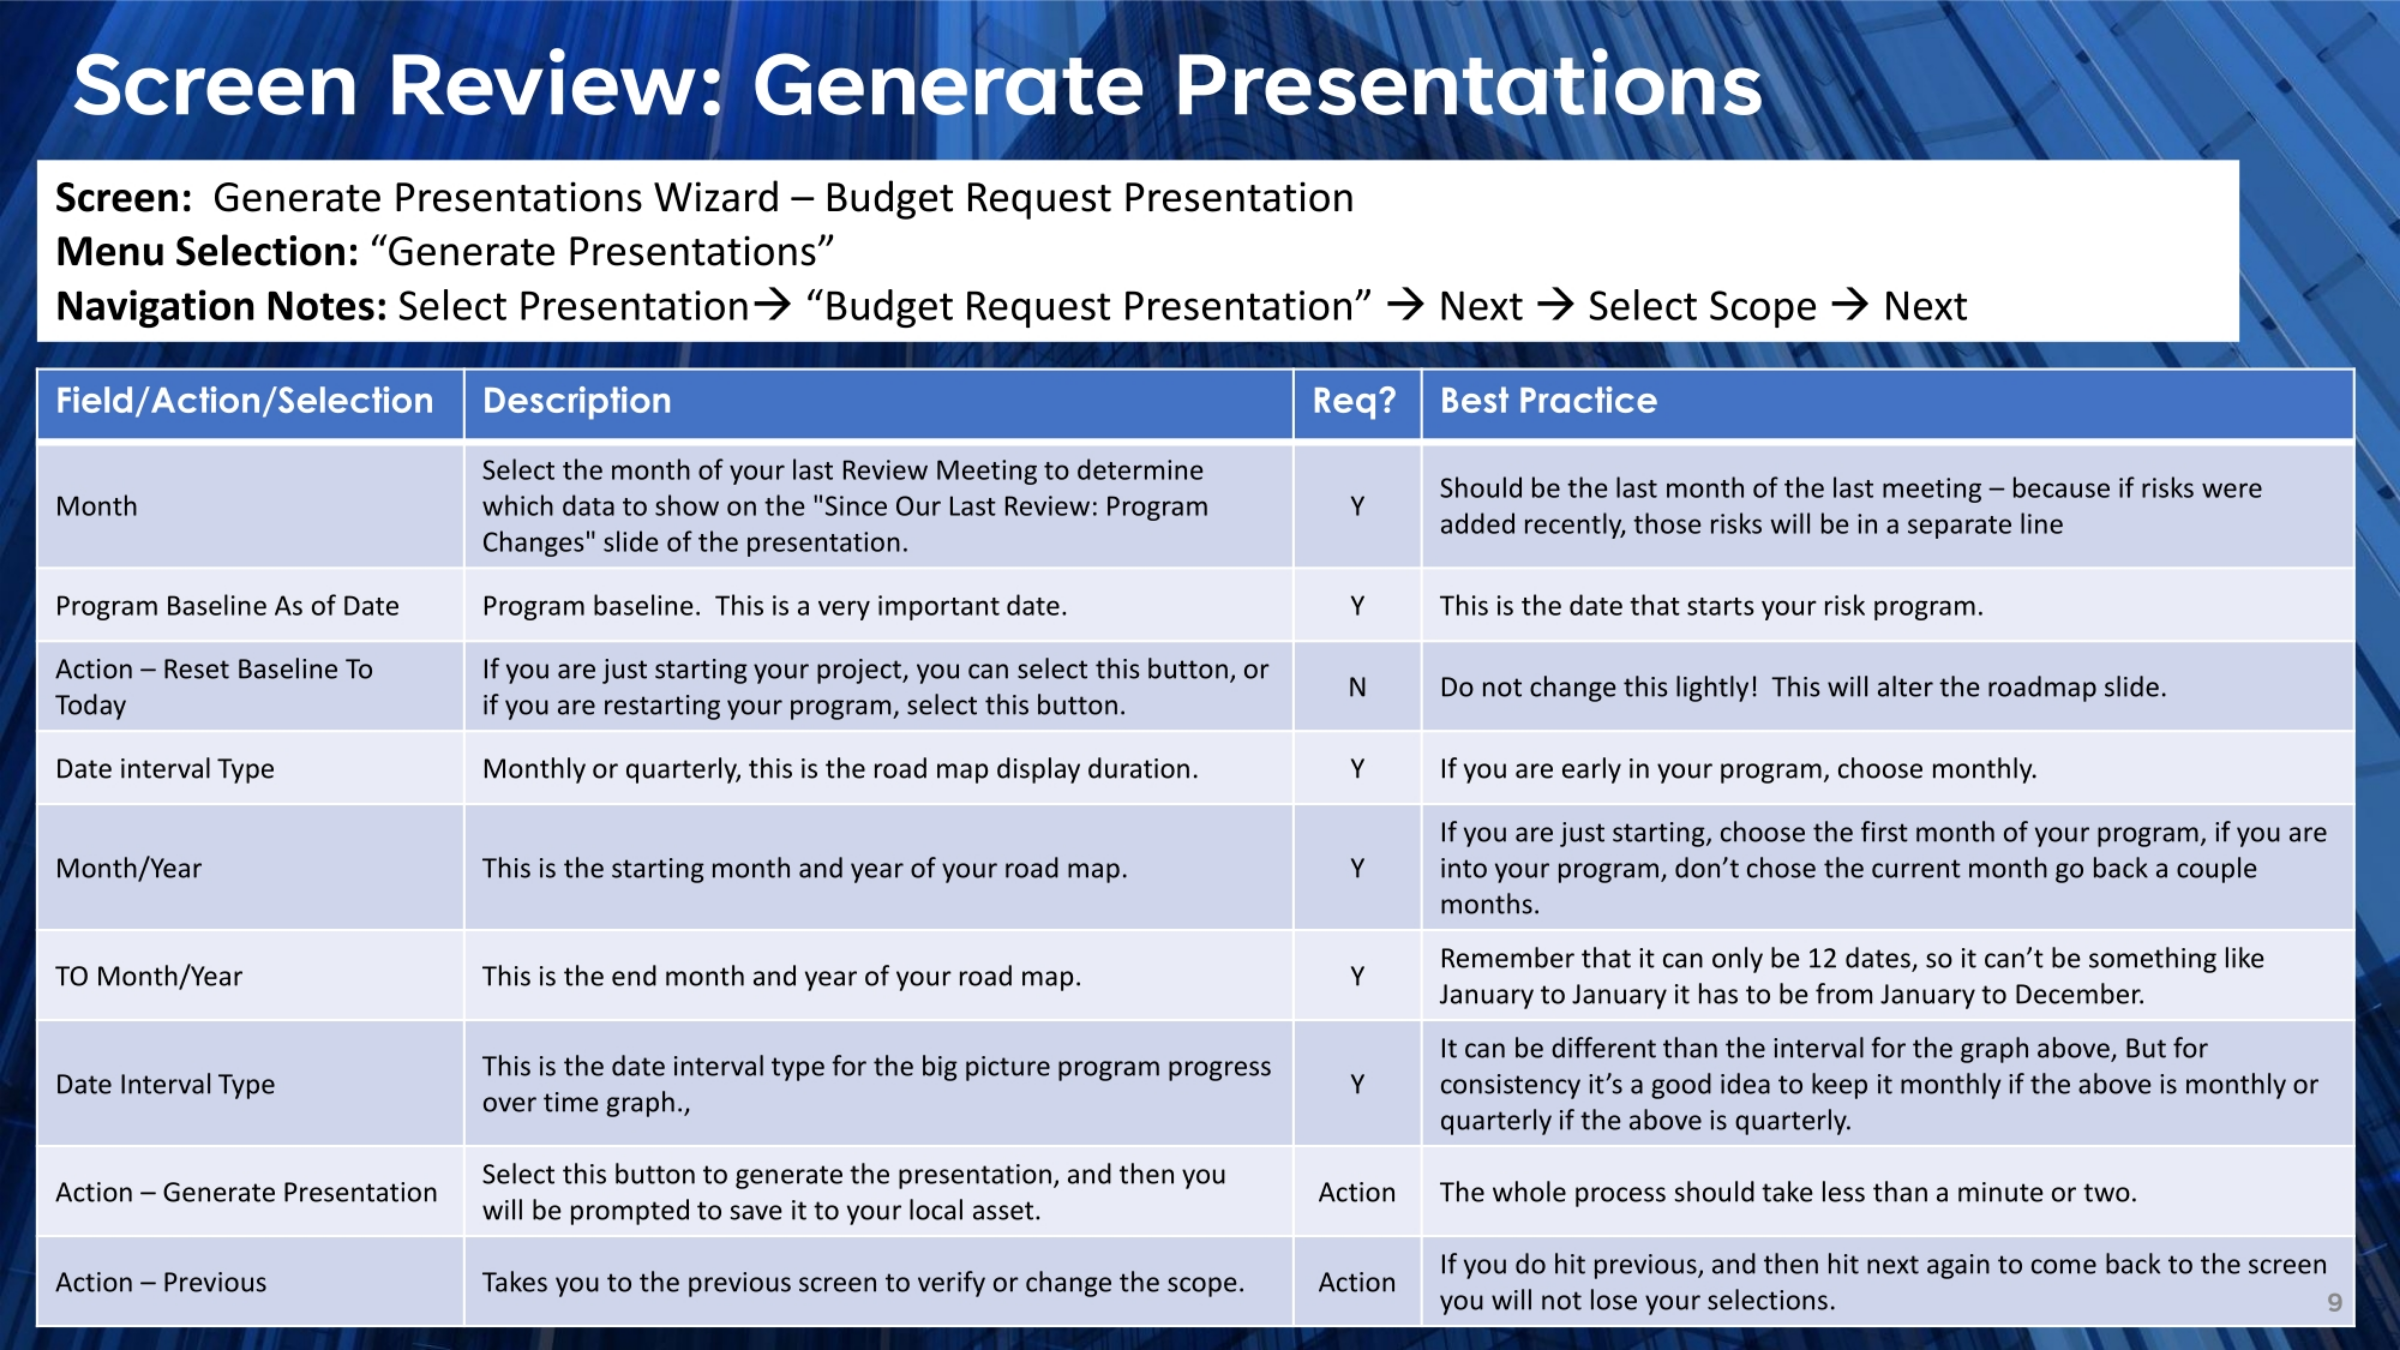
Reviewing the "Generate Presentations" screen, several fields and actions are critical for effective reporting. The "Month" selection should reflect your last meeting to ensure accurate risk data. The "Program Baseline As of Date" is a vital starting point for your risk program, which should not be changed lightly. You can choose monthly or quarterly "Date Interval Types" for your roadmap, spanning up to 12 periods. When selecting "Month/Year" for your roadmap, consider starting a couple of months back if you're already into your program. The "Generate Presentation" action creates the deck, a quick process, and the "Previous" action allows you to verify or change your scope without losing selections.
10. Key Presentation Tips
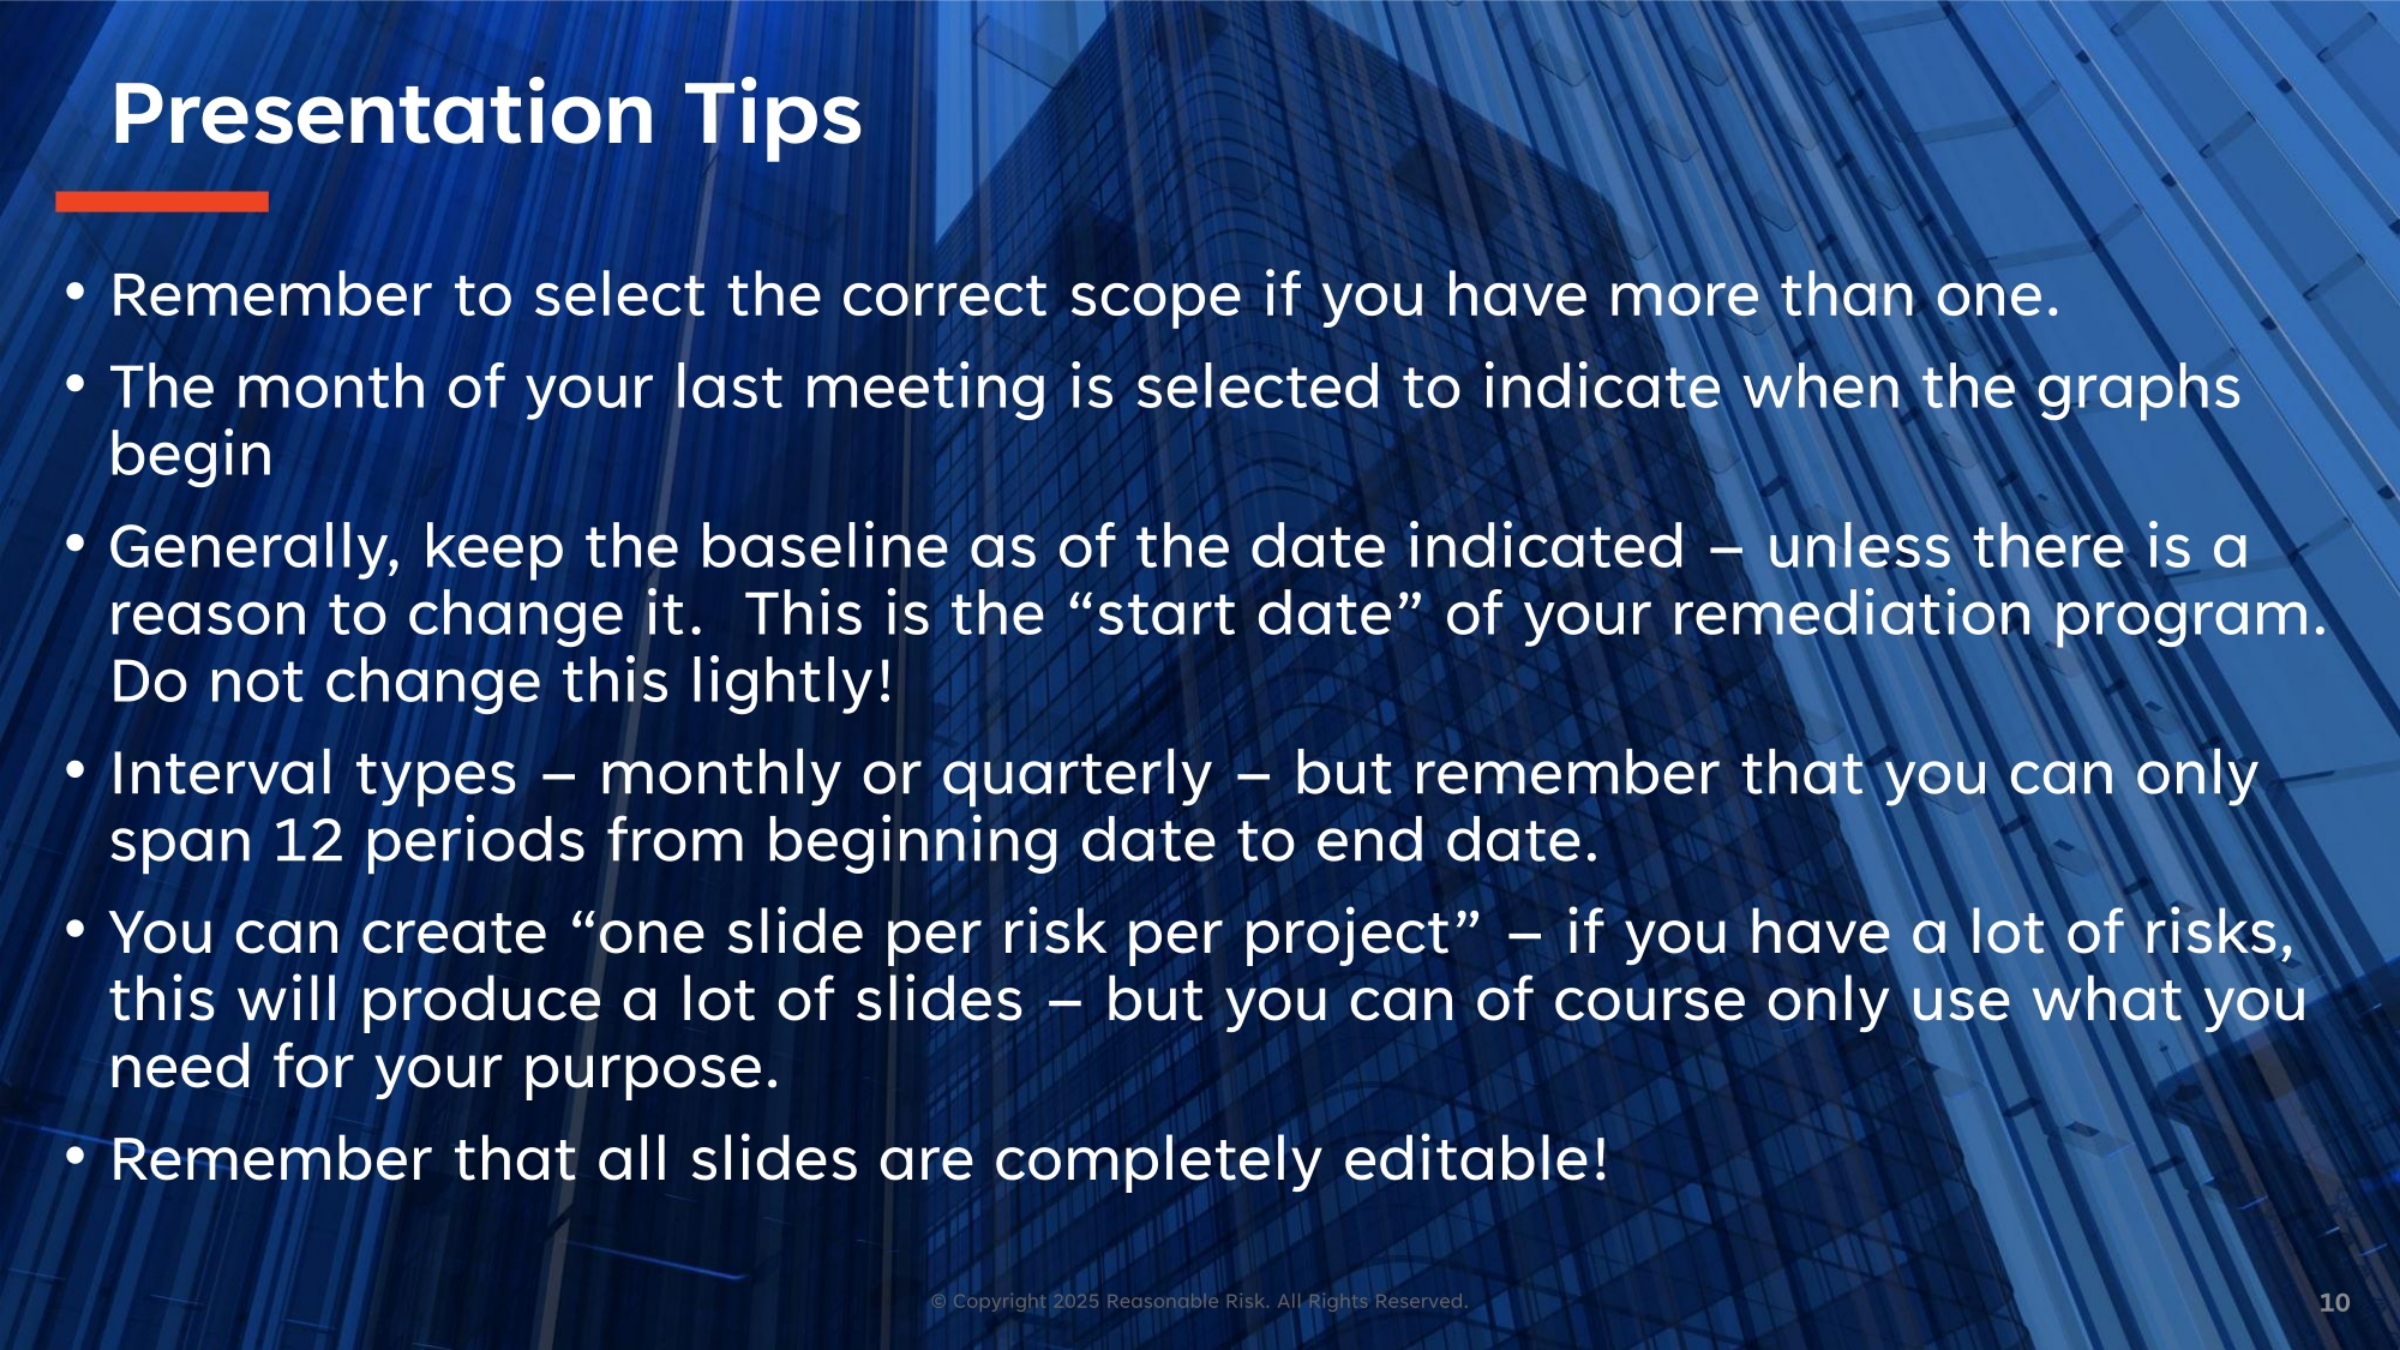
Here are some key tips for optimizing your presentations. Always select the correct scope, especially if you manage multiple. The month of your last meeting determines the graph's starting point. Generally, maintain the indicated baseline date, as it marks the start of your remediation program, and avoid changing it without careful consideration. You can choose monthly or quarterly interval types, but remember you're limited to spanning 12 periods. While you can generate a slide for every risk and project, creating many slides, only use what's necessary for your specific purpose. Crucially, all generated slides are completely editable, allowing for full customization.
11. Demonstration
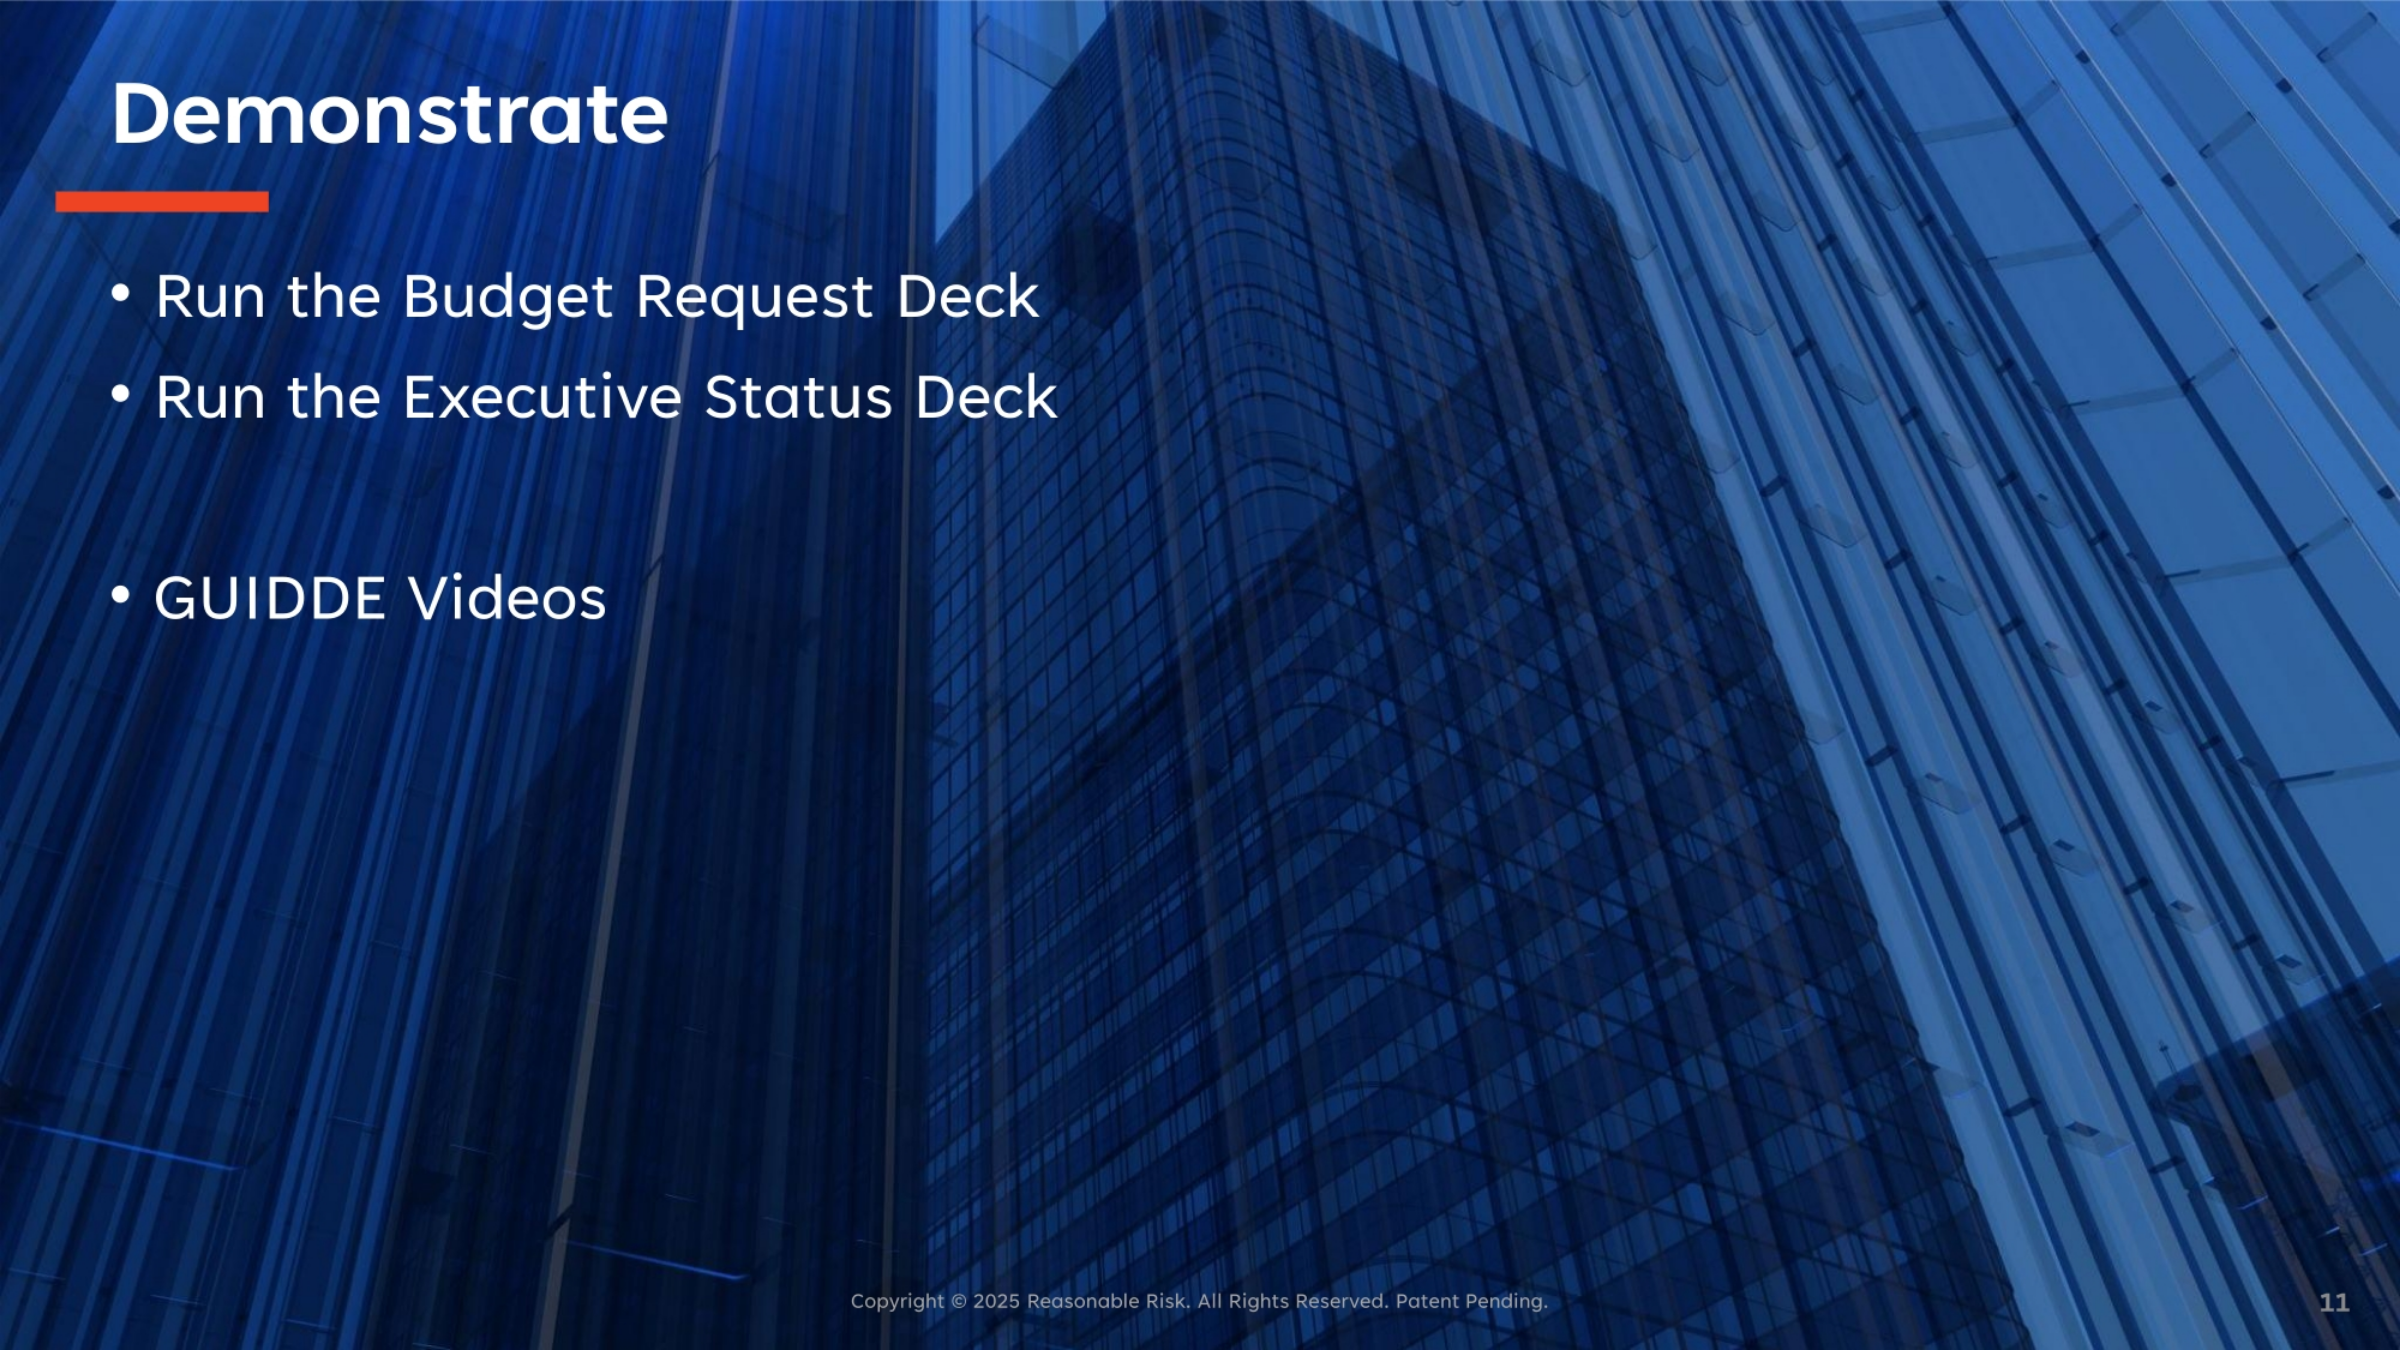
Now, let's move on to a demonstration.
12. Exercise
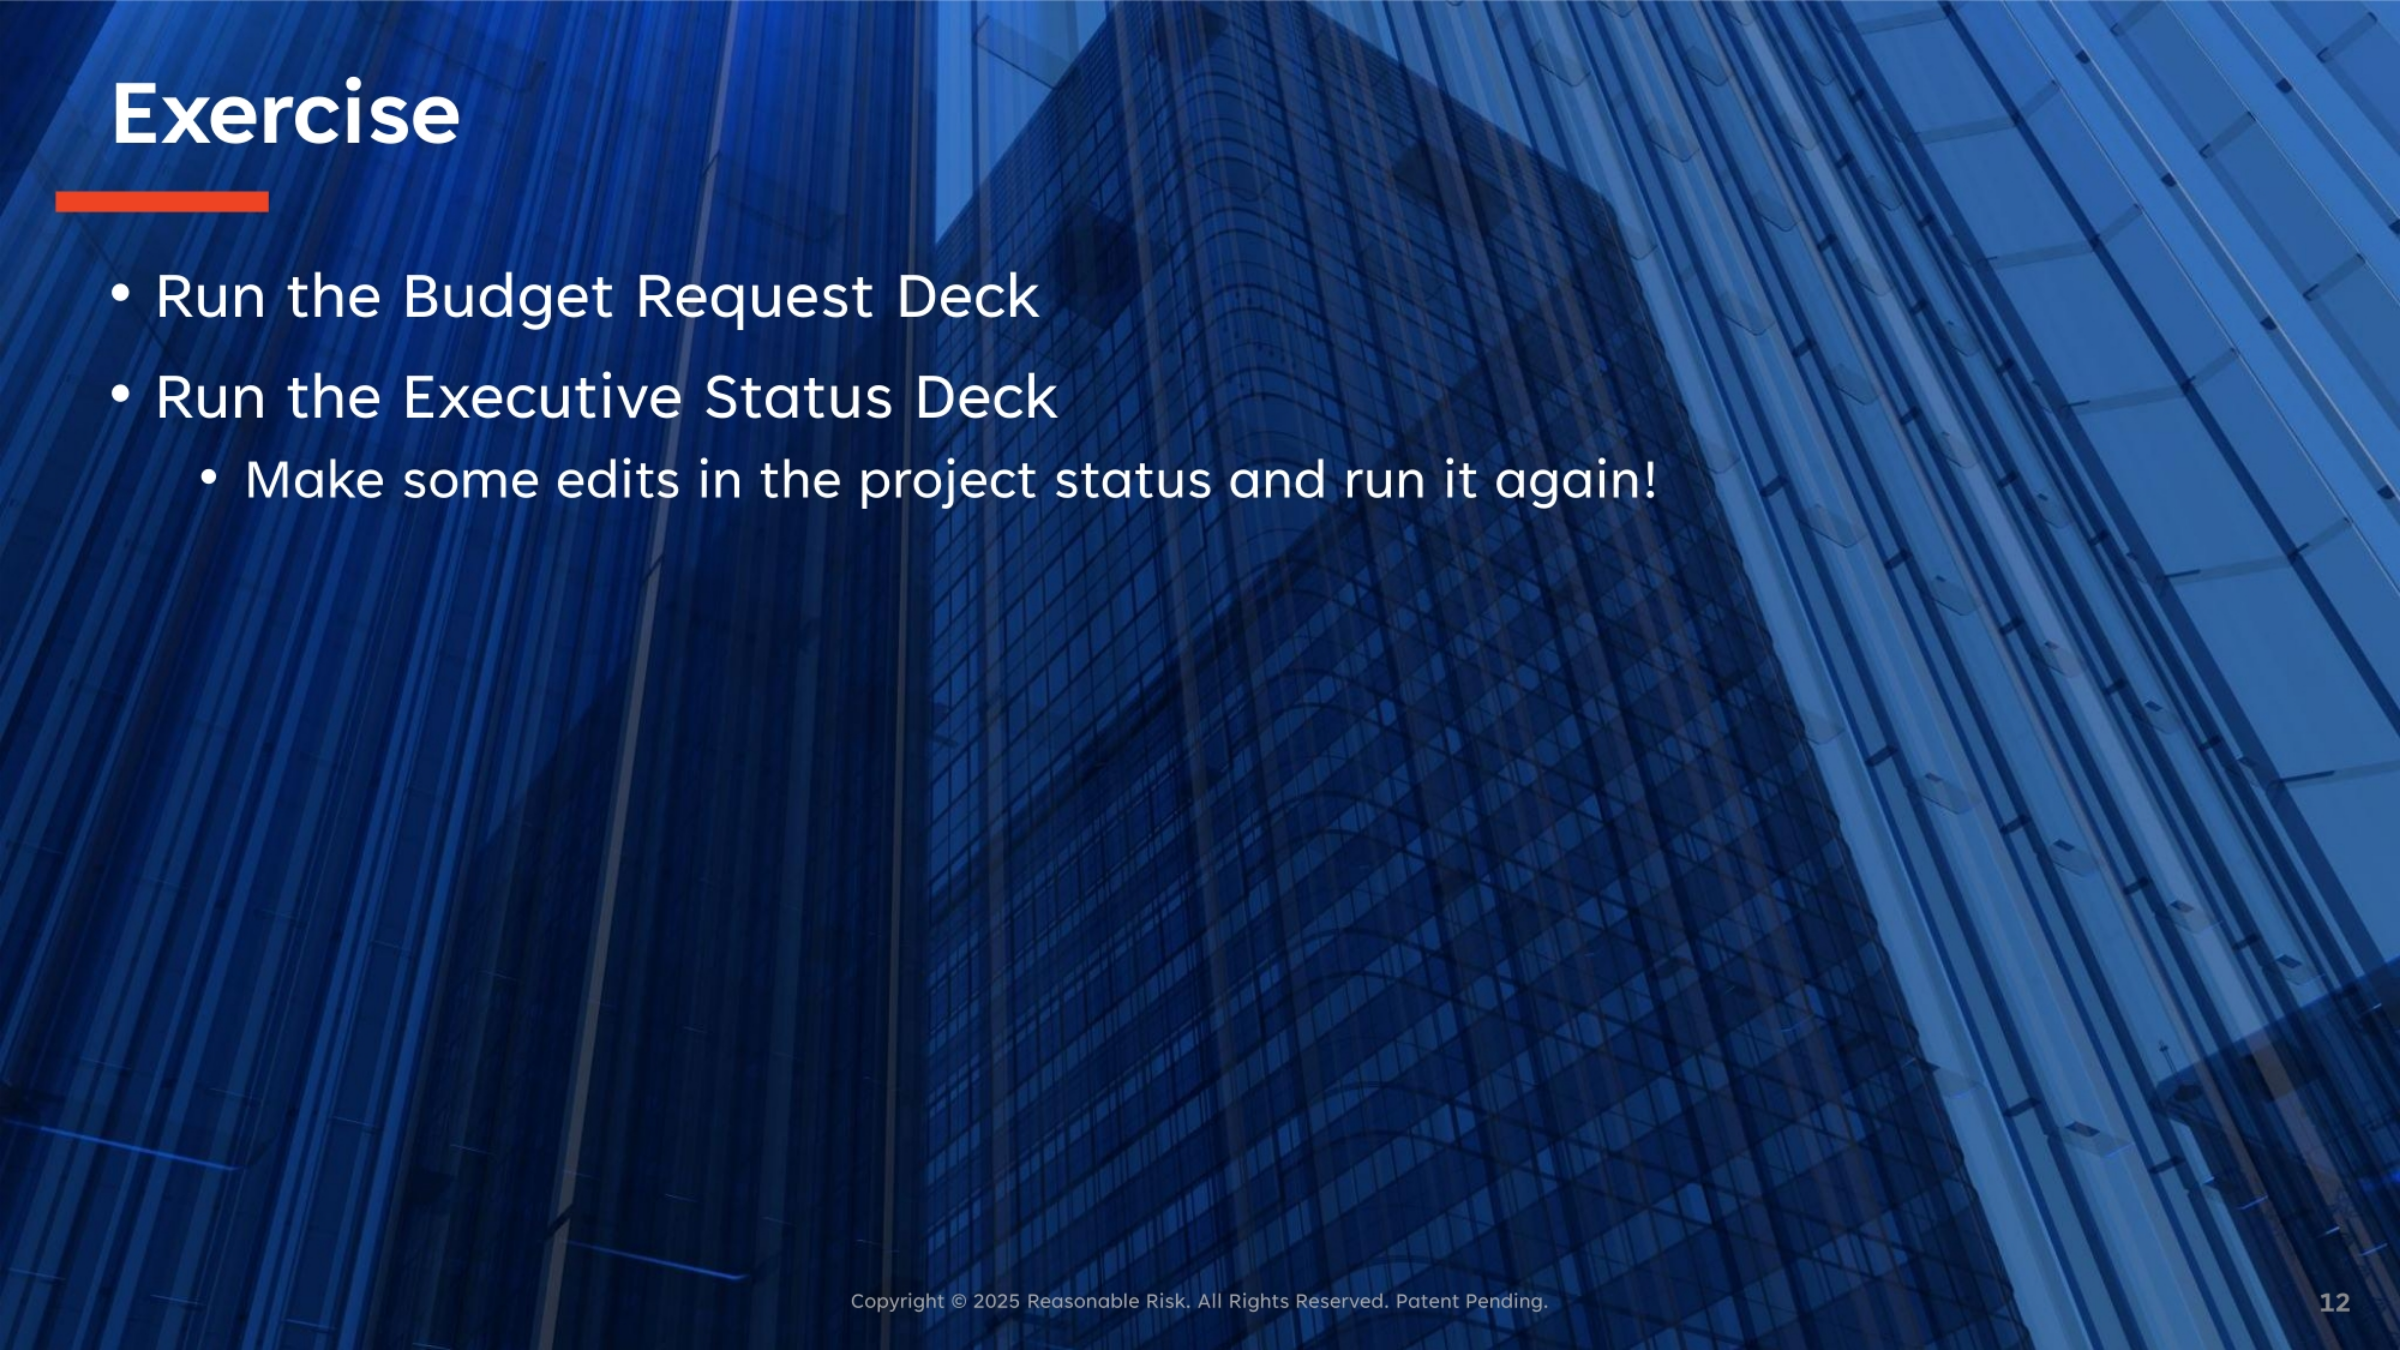
To reinforce your learning, we encourage you to practice running both the Budget Request and Executive Status decks. Try making some edits to project statuses and then running the reports again to see the impact.
In summary, the Reasonable Risk platform offers robust reporting capabilities for generating editable PowerPoint presentations. By understanding the various modules, utilizing the Generate Presentations wizard, and following best practices, users can create impactful Budget Request and Executive Status reports to inform stakeholders and drive remediation efforts.
Comments
0 comments
Please sign in to leave a comment.